


Most furniture retailers don't actually design their fulfillment network. They inherit it. A showroom opens, a warehouse gets leased because it was cheap and nearby, a 3PL gets signed because a competitor used them — and over a few years you end up with a patchwork of nodes that each made sense individually but collectively trap cash and miss delivery windows.
The problem isn't any single node. It's that the network was never evaluated as a financial system where every stocking decision pulls on working capital, every service promise pulls on cost-to-serve, and the two are constantly working against each other.
This is a playbook for making those trade-offs explicitly — translating how you fulfill different SKUs into the math that finance actually cares about: GMROI, working-capital break-even, and the sensitivity ranges that tell you when a decision is solid versus dangerously fragile.
Why fulfillment and finance keep talking past each other
Walk into most furniture operations and you'll find ops optimizing for service — fewer stockouts, faster delivery, happy installers — while finance is focused on cash: lower inventory, better terms, less frozen capital. Both are correct. Neither is looking at the same scoreboard.
The missing bridge is the fulfillment archetype — the specific way a SKU moves from supplier to customer's living room. A floor-stocked sectional and a made-to-order dining table might sit next to each other in the catalog, but they live in completely different financial universes. One carries weeks of holding cost and markdown risk. The other carries deposit float and cancellation risk.
When you don't classify SKUs by archetype, you end up applying one network policy to everything. That's where the money leaks. In practice, this usually shows up as a warehouse full of slow sectionals you're financing at full cost while fast-moving accessories stock out because nobody allocated space or cash to them.
If you haven't already mapped how inventory decisions flow into cash, the inventory-to-capital model for furniture retailers is the foundation this playbook builds on. This post takes that thinking and applies it specifically to network decisions.
The four fulfillment archetypes (and why each needs its own math)
Before you can do break-even math, you need to sort your catalog into archetypes. Across most furniture catalogs, almost everything falls into one of four:
Eliminate inventory headaches and order delays.
Hosyly streamlines your furniture orders and stock management for seamless store operations.
- Real-time inventory tracking
- Automated order processing
- Customer notifications & engagement
No credit card required
| Archetype | How it moves | Primary capital risk | GMROI driver |
|---|---|---|---|
| Floor-stock / forward-held | Held locally, available now | Holding cost + markdown risk | Turn velocity |
| Central-stock / cross-dock | Held centrally, shipped on order | Transfer cost + aging | Pooled demand |
| Made-to-order (MTO) | Built on confirmed order | Deposit float, cancellation | Deposit terms |
| Drop-ship / supplier-direct | Ships from vendor | Margin compression, control loss | Vendor terms |
The mistake isn't choosing the wrong archetype. It's assuming a SKU stays in one forever. A sofa that launches as floor-stock — to drive showroom conversion — might shift to cross-dock once demand stabilizes, then to clearance-stock at end of life. Each transition changes the working-capital math underneath it.
The insight most retailers miss: archetype isn't a fixed property of the product. It's a property of the product at a point in its demand curve. Your network policy should move with that curve, not stay frozen at launch.
Translating archetype into GMROI and break-even
GMROI — gross margin return on inventory investment — is the cleanest single number for comparing fulfillment choices because it combines margin and velocity against the cash you've committed. The formula is straightforward:
GMROI = Gross Margin $ ÷ Average Inventory Cost
The useful part isn't the number itself. It's using it as a gate for each archetype decision.
-
Floor-stock You're holding roughly 6–8 weeks of inventory. If it turns 4x a year at a 42% margin, GMROI might land somewhere around 1.8–2.1. Decent, but you're carrying the full cash exposure.
-
Cross-dock from central Local holding drops to near zero, but you're adding roughly $90–$140 in transfer and handling per unit. Margin compresses a bit, but committed capital drops hard — GMROI can push past 3.0 because the denominator shrinks significantly.
-
Made-to-order With a 40% deposit collected upfront, your net working-capital exposure can actually go negative — the customer is financing part of your supply chain. GMROI becomes almost misleading here, which is why MTO needs a working-capital break-even view more than a GMROI one.
The working-capital break-even for any node answers one question: at what weekly volume does the service benefit of local stock justify the cash we've frozen?
A practical version:
-
Calculate the cash committed to hold the SKU locally (unit cost × units held).
-
Calculate the monthly holding cost (storage + capital cost + shrink/markdown reserve).
-
Estimate the service value of local availability (incremental conversion × margin, plus avoided expedite and transfer cost).
-
Find the volume where service value ≥ holding cost. Below it, the node is losing money. Above it, forward-holding pays.
Most retailers never run step 3, so they justify forward-stock on gut feel. When you actually quantify incremental conversion, a lot of "we have to stock it here" SKUs fail break-even by a wide margin.
SKU archetype assignment rules
You don't want someone hand-classifying 4,000 SKUs by feel. You want rules. A workable starter set:
-
Assign to floor-stock if
demand is consistent (CV under ~0.5), lead time exceeds customer patience, and local availability measurably lifts conversion.
-
Assign to cross-dock if
demand is poolable across locations, the item ships cleanly, and transfer cost is less than the holding-cost penalty of distributed stock.
-
Assign to MTO if
the SKU is high-variety (fabric/finish options), high-ticket, and customers already expect a lead time.
-
Assign to drop-ship if
it's bulky-but-low-margin, infrequently ordered, and the supplier can reliably hit your SLA.
-
Flag for re-archetyping if
a SKU crosses a velocity threshold up or down for two consecutive periods.
That last rule is the one that saves the most money and almost nobody has it. SKUs drift. A rule that forces a review when velocity changes keeps your network from calcifying around last year's demand patterns.
Set automated velocity-change alerts to force re-archetyping reviews.
For the deeper framework on where nodes should physically sit, the guide on when to centralize, cross-dock, or run a multi-tier fulfillment network pairs directly with these archetype rules — archetypes tell you how a SKU moves, that framework tells you where.
Cost-to-serve: the number that breaks most network decisions
Cost-to-serve is where ops and finance finally share a scoreboard, and also where the ugliest surprises tend to live. For bulky furniture, the all-in cost of moving one order to a customer includes far more than freight:
-
Inbound transfer / line-haul
-
Local storage and handling
-
Last-mile two-person delivery
-
Installation / assembly labor
-
Failed-delivery and redelivery rate
-
Returns and damage handling
-
The capital cost of everything sitting in the pipeline
The failure pattern is averaging. When you compute one blended cost-to-serve across the whole catalog, cheap, fast accessories end up subsidizing expensive, failure-prone bulky items — and you can't see which archetypes are actually bleeding margin.
A real example of what un-blending reveals: a mid-size retailer with two showrooms and a shared warehouse assumed their delivered cost-to-serve was roughly $180 per order. When they split it by archetype, floor-stock sectionals came in around $240 — driven largely by a high redelivery rate from narrow appointment windows — while cross-docked case goods landed near $130. The blended average was hiding a node that was quietly unprofitable on every large sofa they moved.
The full build-out of this calculation — including the working-capital overlay — is in the fulfillment-network cost-to-serve model for bulky furniture, which is the companion piece to this playbook. Use that to populate the dollar figures; use this post to decide which archetypes those figures should gate.
Rollout gates: don't flip the whole network at once
The most common way a good network redesign fails is that it gets deployed everywhere simultaneously, so when something breaks you can't tell which change caused it. Stage it with gates.
A sensible rollout sequence:
-
Model gate — Archetypes assigned, cost-to-serve computed per archetype, break-even thresholds set. No operational changes yet.
-
Pilot gate — Re-archetype a small slice — one category, one node. Measure delivery success rate, holding cost, and GMROI against the model's predictions.
-
Validation gate — Does actual cost-to-serve land within your sensitivity range? If reality falls outside the modeled band, stop and fix the assumptions before scaling.
-
Scale gate — Expand archetype rules category by category, never all at once.
-
Monitoring gate — Re-archetyping triggers run on velocity drift; finance and ops review exceptions monthly.
When this staged approach makes sense: any retailer with more than one stocking location or more than a few hundred active SKUs. The coordination cost of a big-bang change is simply too high.
When it's overkill: if you're a single showroom with one supplier and everything is essentially floor-stock or MTO, you don't need rollout gates. You need solid deposit discipline and a clean reorder trigger.
A simple diagram illustrating these gates clarifies responsibilities at each stage.
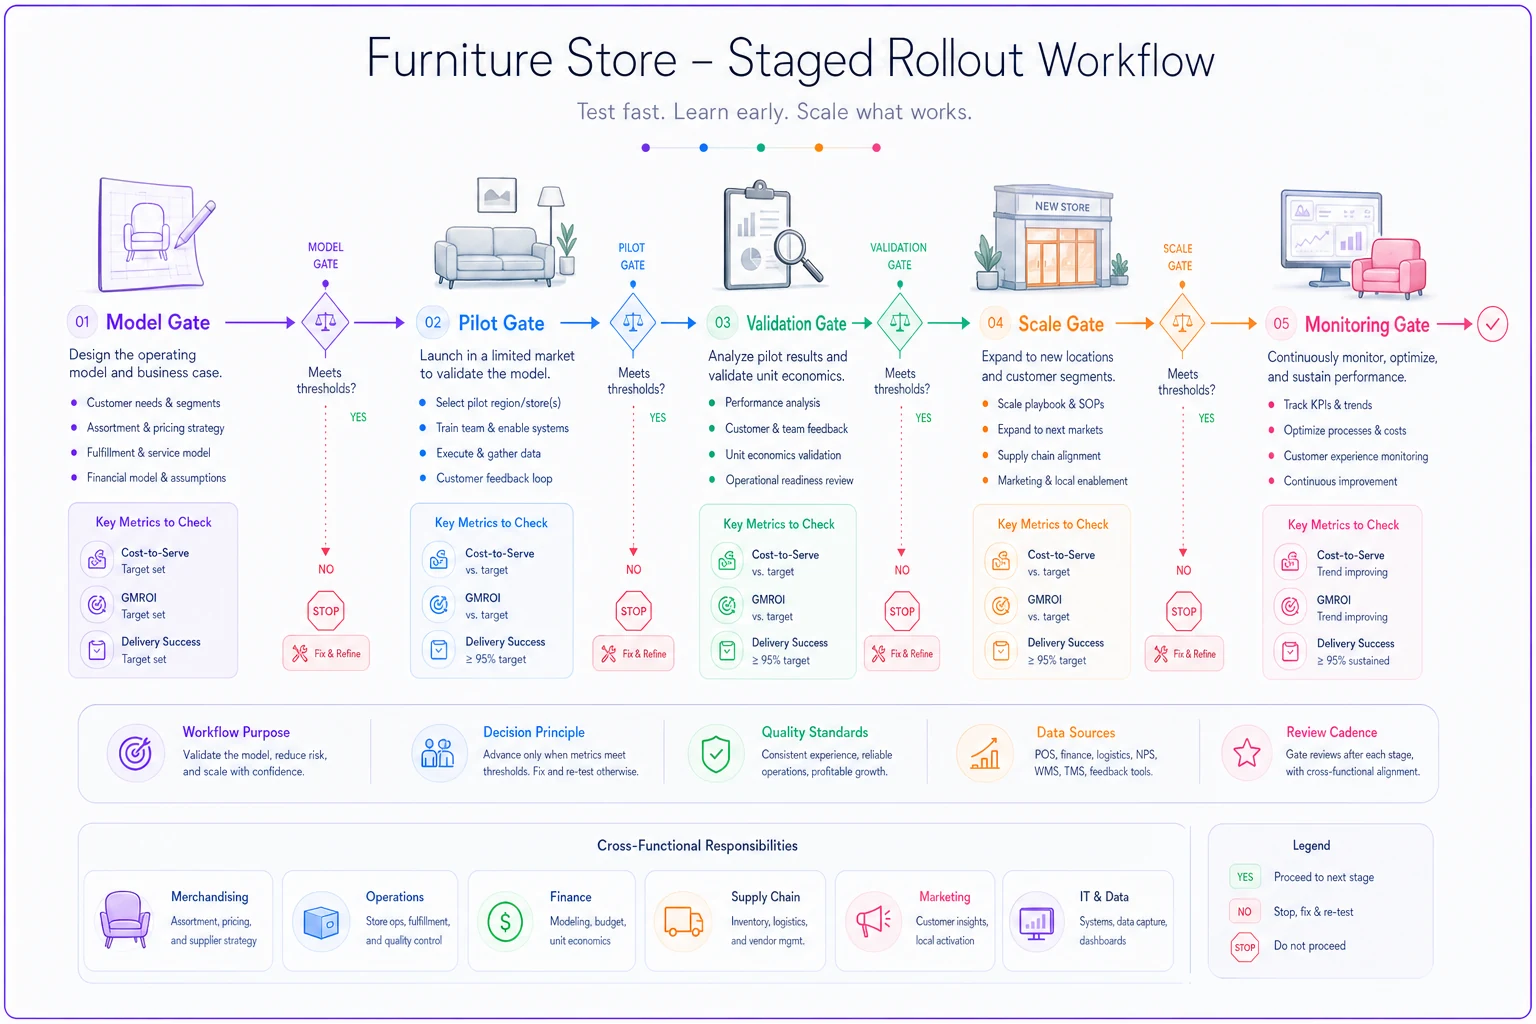
The gate structure above also forces a useful discipline — it separates "our model is wrong" from "our execution is wrong," which is a distinction that gets lost when you roll out everything at once and then try to diagnose results after the fact.
Sensitivity dashboards finance and ops will both use
A single-point cost-to-serve number is a lie with a decimal place. What decisions actually need is the range — and specifically how sensitive the outcome is to the two or three inputs that move it most.
For furniture networks, the inputs that swing results hardest are almost always:
-
Failed-delivery / redelivery rate — every percentage point here is pure margin erosion
-
Fuel and line-haul cost — volatile and significant on bulky freight
-
Holding period — how long inventory ages before it sells or gets marked down
-
Deposit float on MTO — shifts your net working-capital position meaningfully
A finance-facing dashboard should show working capital committed by archetype, GMROI by archetype, and break-even volume versus actual volume for each forward-held node. One glance should answer: which nodes are below break-even, and by how much?
An ops-facing dashboard should show the operational drivers behind those finance numbers — redelivery rate, appointment-window adherence, transfer aging, install success by crew. The point is that both dashboards trace back to the same cost-to-serve model, so ops and finance stop arguing about whose numbers are right.
The pattern worth internalizing: when you run sensitivity on these inputs, you'll often find that one archetype is robust — profitable across the full range of assumptions — and another is fragile, profitable only if everything goes according to plan. Fragile archetypes are where you tighten policy before the next fuel spike or demand slide forces your hand.
A short real scenario
A regional furniture retailer — three showrooms, one central warehouse, a mix of stocked upholstery and made-to-order case goods — was carrying what felt like too much inventory but couldn't pinpoint which part was the problem.
When they ran the archetype split, two things surfaced. Roughly a third of their forward-held SKUs were failing working-capital break-even — they were holding sofas locally that sold too slowly to justify the frozen cash. And their MTO deposit was only 20%, which meant they were financing supplier production out of their own working capital instead of the customer's.
They didn't rebuild the network. They re-archetyped the failing forward-held SKUs to cross-dock, nudged the MTO deposit to 40%, and set a velocity-drift trigger to catch future drift. Over the following couple of quarters, inventory tied up in the warehouse dropped enough to free up cash in the low-to-mid six figures — while delivery success rates held steady, because the SKUs they moved to cross-dock weren't the ones customers needed today anyway.
Nothing exotic. They just stopped applying one policy to four fundamentally different kinds of products.
Where this tends to break at scale
Archetype drift goes unmanaged. With a few hundred SKUs, someone can eyeball what's selling. Past a couple thousand, drift is invisible without a rule that forces a re-review. The network slowly optimizes for last year's demand.
Cost-to-serve data fragments. Freight lives in one system, holding cost in another, redelivery rates in a spreadsheet someone updates when they remember. Without a single place where these roll up by archetype, the sensitivity dashboards get built on stale, partial data — and finance stops trusting them.
Handoffs between nodes lose accountability. A cross-dock model only works if transfer timing is tight. When ownership of transfers is fuzzy, aging inventory piles up at whatever node nobody's watching, and your clean break-even math quietly goes negative.
This is where keeping the model, the cost data, and the triggers connected in one place matters more than any individual calculation. The math isn't particularly hard. Keeping it current and shared across ops and finance at scale — that's the actual work. It's where a central operational system earns its keep, less by being clever and more by making sure everyone's looking at the same break-even line.
Closing thought
Good fulfillment network design for furniture isn't about finding the cheapest warehouse or the fastest carrier. It's about matching each SKU's fulfillment archetype to the financial reality underneath it, then revisiting that match as demand shifts.
Do that consistently, and the old tug-of-war between service and working capital stops being a recurring argument and becomes a set of decisions you can actually defend with numbers — SKU by SKU, node by node, through the whole demand curve.
Good fulfillment network design for furniture isn't about finding the cheapest warehouse or the fastest carrier. It's about matching each SKU's fulfillment archetype to the financial reality underneath it, then revisiting that match as demand shifts.
Do that consistently, and the old tug-of-war between service and working capital stops being a recurring argument and becomes a set of decisions you can actually defend with numbers — SKU by SKU, node by node, through the whole demand curve.
Ready to elevate your furniture business?
Join 500+ furniture retailers using Hosyly to increase efficiency, improve customer satisfaction, and grow revenue.