


Most furniture retailers can tell you their gross margin on a sectional down to the dollar. Ask what it actually costs to serve that sectional — pick, stage, line-haul, final-mile, failed-delivery risk, and the working capital sitting in that unit from the day it lands until the day it's installed — and the room goes quiet.
That gap is where money leaks. Not in dramatic write-offs, but in the slow bleed of a network designed around convenience instead of cost. A cost-to-serve model fixes that. Done right, it tells you which orders you're quietly subsidizing, whether cross-docking beats direct ship on a given lane, and how much cash a network decision frees or traps on the balance sheet.
This is the model I'd hand a CFO. It's built around archetype-level drivers instead of per-SKU noise, it carries real break-even math, and it ends in a dashboard a decision-maker can read in ninety seconds.
Why per-order costing fails for furniture — and what to use instead
The instinct is to cost every SKU individually. For bulky furniture, that's a trap. A single dining table can ship as a flat-pack carton one week and a fully-assembled display piece the next, with completely different handling profiles. Chasing SKU-level precision gives you a spreadsheet nobody maintains and numbers nobody trusts by Q2.
The better unit is the delivery archetype — a cluster of orders that behave the same way through your network. Across furniture operators, roughly 85–90% of fulfillment cost variance is explained by five or six archetypes, not by thousands of SKUs.
A workable starter set:
| Archetype | Typical profile | Primary cost drivers |
|---|---|---|
| A — Small parcel accessory | Lamps, rugs, hardware | Parcel rate, pick labor |
| B — Single bulky, curbside | One chair or small table, no install | Final-mile crew, cube |
| C — Single bulky, room-of-choice + install | Recliner, bed frame | 2-person crew, install time, return risk |
| D — Multi-piece bulky (full room) | Sectional + bed + dresser | Crew hours, truck cube, staging labor |
| E — Mixed cart (accessories + bulky) | Sofa + lamp + rug | Consolidation cost, packing conflicts |
| F — Made-to-order / long-lead | Custom upholstery | Carrying cost, inspection, staging dwell |
Once orders flow into archetypes, you stop arguing about individual SKUs and start reasoning about behavior. That shift is what makes the whole model survive contact with a real operation.
If you've read the breakdown on measuring and lowering cost-per-delivery for mixed orders, archetype E is where that work plugs directly into this model — the packing-conflict and bundling logic becomes a cost driver you can actually quantify here.
The cost-to-serve stack: what actually goes into each archetype
Per-delivery cost isn't one number. It's a stack, and most retailers only track the top two layers.
Eliminate inventory headaches and order delays.
Hosyly streamlines your furniture orders and stock management for seamless store operations.
- Real-time inventory tracking
- Automated order processing
- Customer notifications & engagement
No credit card required
Layer 1 — Direct handling. Pick, pack, stage, load. Labor and consumables. Easy to see.
Layer 2 — Transportation. Line-haul from DC to node, plus final-mile. The one everyone fixates on.
Layer 3 — Install & service. Crew time at the home, assembly, debris removal. For archetypes C and D, this is often larger than the final-mile leg itself.
Layer 4 — Failure cost. Failed deliveries, redeliveries, damage claims, returns. This is the layer that quietly separates a profitable archetype from a loss-making one. A 6% redelivery rate on archetype D can erase the entire margin on a lane.
Layer 5 — Working capital. The cash locked in the unit from receipt to cash-collection. A direct-ship model holds inventory for days; a cross-dock with staging dwell holds it longer. Operators routinely ignore this one. CFOs don't.
Layers 4 and 5 are where network design shows up. Two networks can have nearly identical handling and transport costs and completely different failure and capital profiles. If your model stops at Layer 3, you'll make network decisions blind to the two layers that actually differ between configurations.
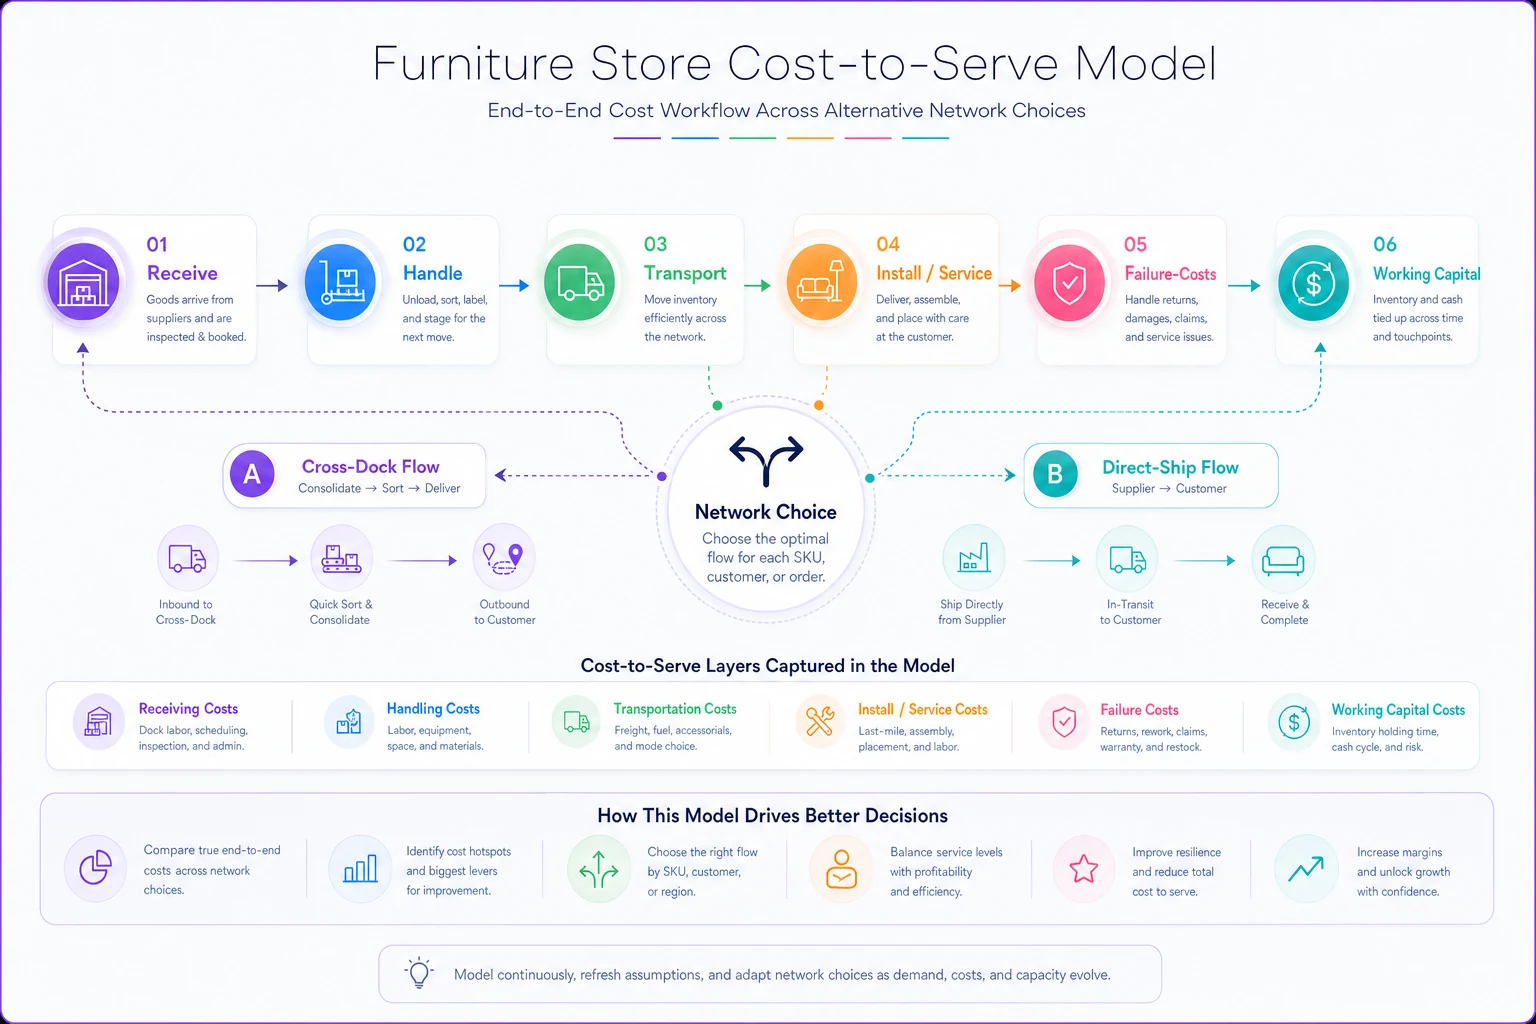
A simple visual of the stack helps non-technical stakeholders see where cost and cash diverge.
A worked example for archetype D
Take a full-room delivery — sectional, bed, dresser — average order value around $4,200.
-
Direct handling
~$48
-
Line-haul allocation
~$70
-
Final-mile (2-person crew, ~1.4 hrs on-site)
~$165
-
Install & debris
~$40
-
Failure cost (blended redelivery + damage, ~5% weighted)
~$55
-
Working-capital carry (18 days at ~14% annualized on landed cost of ~$2,500)
~$17
Fully-loaded cost to serve: roughly $395, or about 9.4% of order value.
The interesting part: only the first three lines are what most teams actually measure. The last three add roughly $112 — nearly a third of the total — and they're invisible on a standard delivery-cost report.
Cross-dock vs direct ship: the break-even that actually matters
This is the decision most multi-location furniture retailers wrestle with, and it's rarely a clean win either way. The framework for when to run each model is covered in the piece on when to centralize, cross-dock, or run a multi-tier network. What follows is the cost math underneath that decision.
Direct ship (supplier → final-mile node → customer) minimizes touches and staging dwell. Lower handling, lower capital carry, but no consolidation — every order rides its own transport economics, and mixed carts get messy.
Cross-dock (supplier → cross-dock → consolidated final-mile) adds a handling touch and some dwell time, but lets you consolidate loads, build denser routes, and cut final-mile cost per stop.
The break-even hinges on three variables: volume density on the lane, average pieces per delivery, and failure rate sensitivity to handling.
The break-even logic, step by step
-
Calculate per-delivery final-mile cost under direct ship at current route density.
-
Calculate consolidated final-mile cost per delivery under cross-dock at the improved density cross-docking enables.
-
Add the cross-dock's incremental handling and dwell-driven capital cost.
-
Break-even volume is the point where (final-mile savings from consolidation) = (added handling + added capital carry).
-
Layer in the failure-cost delta — cross-docking adds a touch, which can raise damage risk on fragile bulky items, or lower failed deliveries by enabling tighter appointment windows.
A typical pattern: cross-dock wins once a lane sustains roughly 35–45 deliveries per week with 1.8+ pieces per delivery. Below that, the handling touch and staging capital don't pay for themselves. Above it, consolidation savings compound quickly.
The mistake most retailers make is applying one answer network-wide. A dense metro lane and a rural lane can land on opposite sides of the break-even curve, yet operators pick one model and force every order through it.
Sensitivity tables: where the model earns its keep
A single cost number is false precision. The value is in seeing how the answer shifts when inputs change. Two sensitivities matter most for furniture networks.
Sensitivity 1 — Final-mile cost per delivery vs. route density (archetype D, cross-dock lane):
| Deliveries / route | Final-mile cost per delivery |
|---|---|
| 4 stops | ~$215 |
| 6 stops | ~$165 |
| 8 stops | ~$138 |
| 10 stops | ~$121 |
The curve is steep early and flattens out. The first few stops added to a route are worth far more than the last ones. Chasing a 10th stop on a tight window often costs more in missed appointments than the density saves.
Sensitivity 2 — Fully-loaded cost to serve vs. failure rate (archetype D):
| Weighted failure rate | Added failure cost | Cost to serve |
|---|---|---|
| 2% | ~$22 | ~$362 |
| 5% | ~$55 | ~$395 |
| 8% | ~$88 | ~$428 |
| 12% | ~$132 | ~$472 |
A six-point swing in failure rate moves cost to serve by about $110 — roughly the same magnitude as switching network models entirely. Operators who obsess over transport rates while ignoring redelivery discipline are optimizing the wrong variable.
Build both tables per archetype. Once you can see which lever moves cost the most on each archetype, your capex and process-improvement priorities basically sort themselves.
The working-capital angle CFOs actually want
Cost to serve is the income-statement story. Working capital is the balance-sheet story, and network choices hit both.
Every network design implies a different cash-conversion profile on the inventory flowing through it:
-
Direct ship typically holds a unit 3–7 days between supplier dispatch and customer install. Minimal staging dwell, minimal trapped cash.
-
Cross-dock adds staging dwell — often 2–5 extra days — which looks small until you multiply it across full flow-through volume.
-
Centralized stocking can add 20–60 days of carry, which is enormous for high-ticket furniture.
The working-capital math that ties directly into an inventory-to-capital model is this: each extra day of dwell on a $2,500 landed-cost unit, at roughly 14% annualized cost of capital, runs about $0.96/day. Trivial per unit. But at 400 units/month moving through an extra four days of staging, that's around $1,500/month — $18k/year — in pure financing cost for a network choice nobody costed.
The uncomfortable part: a network model can lower your per-delivery cost while raising your working-capital tie-up. If you only track one, you'll congratulate yourself for a decision that quietly worsened your cash position. Both numbers belong on the same dashboard.
The executive dashboard template
One screen, per archetype, mapping network choice to cost and cash.
Top row — the headline numbers (per archetype):
-
Fully-loaded cost to serve ($ and % of AOV)
-
Cost to serve under alternate network model (the "what if we switched" number)
-
Working-capital days tied up
-
Weighted failure rate
Middle row — the levers:
-
Route density (actual vs. break-even)
-
Failure cost as % of cost to serve
-
Staging dwell days
-
Cross-dock vs direct-ship delta on this lane
Bottom row — the flags:
-
Archetypes currently served below break-even density (red)
-
Lanes where capital carry exceeds transport savings (amber)
-
Archetypes where failure cost is the #1 driver (watch)
A clean version reads like this in plain language:
> Archetype D, Metro-North lane: cost to serve $395 (9.4% AOV). Direct-ship alternate would cost $441. Route density 7.2 stops vs 5.5 break-even — cross-dock justified. Working capital 18 days, within target. Failure rate 5%, driving 14% of cost. Status: green, hold.
> Archetype D, Rural-West lane: cost to serve $462. Cross-dock alternate $448. Route density 3.1 stops vs 5.5 break-even — cross-dock NOT justified. Flag: switch this lane to direct ship.
That second line is the whole point of the exercise. Same archetype, same company, opposite correct answer — and without the model you'd never see it.
The dashboard doesn't need to be pretty. It needs to tell someone in ninety seconds whether each lane is in the right configuration and which ones aren't. That's it.
Keeping the model alive: the data problem
A cost-to-serve model is only as good as the inputs behind it, and this is exactly where most of them die. Someone builds a solid spreadsheet, it's accurate for one quarter, then route density shifts, carrier rates reset, failure rates creep, and nobody re-feeds the model. Six months later the dashboard says "green" on a lane that's been bleeding for weeks.
The practical fix is wiring a small number of live drivers straight from your order and delivery systems:
-
Actual stops-per-route by lane (from routing/dispatch)
-
Redelivery and damage-claim rates by archetype (from service tickets)
-
Landed cost and actual dwell days (from receiving and install timestamps)
-
Carrier/crew cost per delivery (from settlement data)
Prioritize making stops-per-route, failure rate, and dwell live first — they swing the answer quickly.
You don't need every variable live — handling and install times move slowly and can be refreshed quarterly. But density, failure rate, and dwell move fast, and those three are the ones that swing the answer. Operational platforms that already capture dispatch, service tickets, and receiving timestamps can push those drivers into the model automatically, so the dashboard reflects last week instead of last quarter.
A cost-to-serve model fed by stale numbers is worse than no model — it hands you false confidence dressed up in decimal points.
A real scenario
A regional furniture retailer with three showrooms and a shared DC was running everything cross-dock on principle — "consolidation saves money." Average order was mid-range, around $3,800, mostly archetypes C and D.
When they ran the archetype model, two things fell out immediately. Their two metro lanes were comfortably past break-even — cross-dock was correct and saving roughly $40 per delivery. But their two outlying lanes were running at 3–4 stops per route, well under break-even, and the forced cross-dock touch was adding handling cost and an average of four extra staging days. On those lanes they were paying more per delivery and carrying inventory longer at the same time.
They split the policy: cross-dock the metros, direct-ship the outliers. Per-delivery cost on the outlying lanes dropped by roughly $25–30, and the staging dwell came off those units entirely — freeing somewhere around $12k–$15k of working capital that had been sitting in transit limbo. No new trucks, no new headcount. Just matching the network model to where each lane actually sat on the break-even curve.
The outcome that mattered to their CFO wasn't the per-delivery saving. It was that cost-to-serve and cash finally lived on the same page, so network decisions stopped being a gut call.
When this model is worth building — and when it isn't
Build it if:
-
You run more than one fulfillment node or any mix of cross-dock and direct ship
-
Your archetypes genuinely differ in cost behavior (most furniture retailers qualify)
-
Working capital is tight enough that trapped cash actually hurts
-
You're about to make a network capex decision and want the numbers defensible
Skip it (for now) if:
-
You're single-location, single-model, with uniform orders — your cost to serve is basically one number and a model is overhead
-
You can't get even rough failure-rate and dwell data yet. Fix the measurement first; a model built on guessed inputs just launders guesses into decimals.
Who should be cautious: operators tempted to build this at full SKU granularity. You'll spend three months on a model that's obsolete on delivery. Start with five or six archetypes and three live drivers. A coarse model that gets used beats a precise one that rots in a drawer.
The version that actually survives inside a real business is always simpler than the version someone first proposed.
Bringing it together
A fulfillment-network cost-to-serve model for furniture isn't a costing exercise — it's a decision instrument. It exists to answer, lane by lane and archetype by archetype, two questions a CFO and an operations lead should agree on: what does it actually cost us to deliver this, and how much of our cash does the network trap along the way?
Retailers who get this right stop treating cross-dock versus direct ship as a philosophy and start treating it as math that varies by lane. They see the failure-cost and working-capital layers that standard reports hide. They put both the income-statement number and the balance-sheet number on one screen, so a network choice that lowers delivery cost while quietly strangling cash gets caught before it's funded — not six months after.
Start with the archetypes, cost the full stack including failure and capital, run the break-even per lane, and refresh the three drivers that actually move. That's the whole system — and it's the difference between a network you designed and one you merely inherited.
A fulfillment-network cost-to-serve model for furniture isn't a costing exercise — it's a decision instrument. It exists to answer, lane by lane and archetype by archetype, two questions a CFO and an operations lead should agree on: what does it actually cost us to deliver this, and how much of our cash does the network trap along the way?
Ready to elevate your furniture business?
Join 500+ furniture retailers using Hosyly to increase efficiency, improve customer satisfaction, and grow revenue.