



Most furniture retailers don't run out of demand. They run out of usable cash. There's plenty of inventory — it's just sitting in the wrong SKUs, at the wrong margin, with the wrong turn, and every one of those SKUs is quietly holding hostage a slice of working capital that could be funding faster-moving stock, better payment terms, or the marketing spend that actually moves sofas.
The frustrating part is that the problem doesn't show up in the P&L until it's already bad. Your income statement looks fine. Your gross margin looks fine. Meanwhile your bank balance keeps tightening and nobody can quite say why. That gap — between "we're profitable on paper" and "we can't pay the deposit on next season's order" — is the gap this article is about.
What follows is a systems-level model that connects three things most furniture businesses track separately: turn, lead time, and margin at the SKU level, and translates them into a single number you can actually manage — cash-at-risk. Then we'll get into the breakpoint math, the deposit/consignment/BNPL tradeoffs, how markdown timing quietly drains cash, and what the dashboards and decision rules should look like for the two people who fight over this constantly: merchandising and finance.
Why margin lies to you (and turn tells the truth)
Merchandisers are usually rewarded on margin and sell-through. Finance cares about cash conversion. Those are not the same thing, and in furniture they can point in opposite directions.
A dining set with a 48% margin that turns 1.4 times a year is a worse cash asset than an accent chair at 32% margin that turns 5 times. The dining set looks like the winner on any margin report. But if you trace the cash, the chair is recycling your capital more than three times as often — meaning the same dollar of inventory investment throws off far more usable gross profit per year.
The number that matters is GMROI (gross margin return on inventory investment), and most furniture stores don't run it at the SKU level:
> GMROI = Gross Margin % × Inventory Turns
So the 48% / 1.4-turn dining set produces a GMROI of roughly 0.67 — you're getting back 67 cents of gross margin for every dollar tied up. The 32% / 5-turn chair produces 1.60. That's the difference between capital that works for you and capital that just sits.
What tends to happen across a lot of furniture operations is that the assortment quietly fills up with high-margin, low-turn "anchor" pieces because they feel premium and they look good on a margin report — while the boring, fast items that actually fund the business get under-ordered because nobody's watching their turn-adjusted contribution.
The cash-at-risk lens
Cash-at-risk is the operating number that ties everything together. Think of it as: how much capital is exposed to loss or stranding right now, given how each SKU is aging and how it was financed.
Eliminate inventory headaches and order delays.
Hosyly streamlines your furniture orders and stock management for seamless store operations.
- Real-time inventory tracking
- Automated order processing
- Customer notifications & engagement
No credit card required
Cash-at-risk = (Landed inventory cost still on hand) × (Probability of markdown or write-down) × (Expected markdown depth) — plus any committed deposits on inbound units that haven't sold through.
This matters more in furniture than in almost any other retail category because of the combination of long lead times and bulky, hard-to-liquidate stock. When a fashion retailer misreads demand, they mark down and clear in a few weeks. When you misread demand on a 12-week-lead sectional, you're holding it, warehousing it, and eventually eating a much deeper markdown because the liquidation channels for bulky goods are thin and expensive to move.
A typical scenario looks like this. A store commits to 40 units of a new sofa line at a landed cost of about $620 each — roughly $24.8k of capital. They've paid a 30% deposit upfront ($7.4k) and the balance on delivery. Twelve weeks later, 14 units have sold, 26 are sitting. The reorder point has already triggered in their system because it's blind to aging, so another PO is queued. Now the cash-at-risk isn't just the 26 unsold units — it's the 26 units plus the deposit on units that shouldn't be reordered at all.
That compounding — bad demand read → automatic reorder → deeper eventual markdown → more capital stranded — is the loop the model is designed to break.
Breakpoint math: the number every buy should clear
Before you commit to any order, there's one calculation worth making: the minimum weekly sell-through rate that keeps the SKU cash-positive over its lead-time-plus-selling window.
You're going to have capital tied up from the moment you pay a deposit until the last unit sells. The longer that window, the more the SKU needs to earn per week just to justify the capital it's freezing.
-
Order
40 units, landed cost $620, retail $1,099 (about 44% margin)
-
Lead time
12 weeks
-
Target
fully clear within 20 weeks of arrival
-
Total capital cycle
~32 weeks
To clear 40 units in 20 selling weeks, you need 2 units/week. That's your breakpoint. If your realistic demand read is 1.2 units/week, you're not looking at a 20-week clear — you're looking at a 33-week clear, which pushes a chunk of that stock into markdown territory and roughly doubles the time your capital is frozen.
The decision rule is blunt and useful: if forecasted sell-through is below the breakpoint, cut the order quantity until the math clears — don't cut the margin, cut the units. Over-ordering at full margin is a far more common and expensive mistake than under-ordering. The downside of under-ordering is a lost sale. The downside of over-ordering is stranded capital plus a future markdown.
Financing structure changes the whole calculation
How you finance the buy and how customers pay you shifts the cash-at-risk profile as much as the demand read does. Three levers matter most: supplier deposits, consignment, and customer-side BNPL. They don't just redistribute risk — they change when cash moves, which is the whole game.
| Structure | Capital tied up upfront | Cash-at-risk profile | Best fit |
|---|---|---|---|
| Full prepay / large deposit | High (30–50% at PO) | High — you're exposed before a single unit sells | Proven, fast-turn SKUs with tight demand confidence |
| Small deposit + balance on delivery | Medium | Medium — exposure builds as stock lands | Established lines with moderate turn |
| Consignment | Low to none | Low — supplier holds title until sale | New/unproven lines, high-ticket experimental pieces |
| Customer BNPL | None (you're paid upfront by provider) | Low on inventory, but watch fee drag | High-ticket sales where financing lifts conversion |
Consignment is the most underused lever in furniture, and it's ideal exactly where cash-at-risk is highest: new, unproven, high-ticket lines. If you can get a supplier to consign the first 15–20 units of a new sectional, you've moved the entire demand-read risk off your balance sheet during the riskiest window. You give up a few points of margin, but you're buying that margin back in capital you didn't strand.
On the customer side, BNPL is genuinely useful for high-ticket conversion — but the mistake is treating the provider fee as marketing cost when it's really a margin deduction. If a provider takes 4–6% and you're already at 40% margin, you've quietly moved to mid-30s. Fine if it lifts close rates on a $3k sale; not fine if you're stacking it on top of a discount. We went deep on this tradeoff in our breakdown of how to evaluate BNPL and installment options without increasing credit exposure — worth reading alongside this if you're actively negotiating provider terms.
When each structure is a bad idea
-
Large deposits are a bad idea when demand confidence is anything below "we've sold this exact line before and it turned." You're paying to freeze capital on a guess.
-
Consignment is a bad idea for your core fast-movers — you're giving away margin on stock you'd sell anyway, and suppliers often won't consign the good stuff regardless.
-
BNPL is a bad idea as a blanket policy across the whole catalog. It earns its fee on high-ticket, financing-sensitive sales, not on a $180 accent table.
When each structure is a bad idea
Markdown cadence: the slow leak nobody times correctly
The pattern that quietly costs furniture retailers the most: they mark down too late and too shallow, repeatedly. The instinct is to protect margin by nudging a slow SKU down 10%, waiting a month, nudging another 10%, waiting again. On paper that feels disciplined. In cash terms it's the worst possible cadence.
Every week a slow SKU sits, it accrues carrying cost — warehousing, capital cost, and rising markdown probability as the item ages toward "clearance" perception. A unit that would have cleared at a 20% markdown in week 22 often needs 40% by week 40, because the market for it decays and the aging itself signals staleness to shoppers.
The better cadence is fewer, deeper, faster steps on SKUs that have already missed their breakpoint. If a SKU is tracking to a 33-week clear against a 20-week target, don't dribble it down. Take a decisive markdown early enough that the recovered capital can be redeployed into something that actually turns. The phased approach to retiring dead stock without alienating customers is its own discipline — we laid out a full rationalization plan for slow-moving SKUs here that pairs well with this cash model.
The insight most people miss: markdown decisions are really capital redeployment decisions. The question isn't "how do I protect margin on this stuck unit." It's "what's the fastest way to convert this stranded capital back into a SKU that clears my breakpoint."
A real scenario
A single-location furniture store, roughly $2.9M in annual revenue, kept running into a familiar wall: profitable on paper, chronically tight on cash, constantly delaying reorders on their best-selling bedroom sets because the money was stuck elsewhere.
When they actually mapped cash-at-risk at the SKU level, the picture was stark. About $310k of inventory value — close to a third of their on-hand — was concentrated in SKUs with GMROI below 1.0. Several "premium" living room lines that everyone loved on the floor were turning under 1.5x and had been quietly reordered twice by an aging-blind reorder point.
The changes weren't dramatic. They set a GMROI floor of 1.2 for reorders, moved two unproven high-ticket lines to consignment for the initial buy, and replaced the drip markdown habit with a single decisive markdown at the breakpoint miss. Within about two quarters, they'd freed up somewhere in the range of $70k–$90k in working capital — enough to stop delaying reorders on the fast bedroom sets, which were the actual engine of the business.
Revenue didn't jump overnight. What changed was that the same revenue stopped choking on stranded capital.
What the dashboards should actually show
Merchandising and finance need to see the same reality, which almost never happens because they're pulling from different reports. The fix is a shared, SKU-level view with a small number of decision-triggering fields. Overbuilt dashboards get ignored; the useful ones fit on one screen.
Merchandiser dashboard — the buy/hold/cut view:
-
SKU, current on-hand units and landed value
-
GMROI (rolling)
-
Weeks-of-supply vs. breakpoint weeks-of-supply
-
Sell-through rate vs. required breakpoint rate
-
Aging bucket (weeks since arrival)
-
Reorder flag — suppressed automatically if GMROI < floor or below breakpoint
Finance dashboard — the cash-at-risk view:
-
Total inventory value by GMROI band (above 1.5 / 1.0–1.5 / below 1.0)
-
Committed deposits on inbound POs not yet sold through
-
Cash-at-risk total (aging × markdown probability × depth)
-
BNPL fee drag as a running margin deduction
-
Projected capital freed by pending markdowns
Suppress reorder flags automatically for SKUs that fall below the GMROI floor to prevent aging-blind reorders.
The point of splitting them is that each role acts on its own numbers, but both are computed from the same underlying SKU data — so merchandising and finance stop arguing about whose spreadsheet is right.
The decision gates that make it operational
A model only matters if it changes what happens on a Tuesday when someone's about to place an order. These are the gates worth hard-coding into your process:
-
Buy gate. No PO clears without a forecasted sell-through above the breakpoint rate and a projected GMROI above your floor. If it fails, the default action is reduce quantity, not abandon.
-
Financing gate. Any new or unproven high-ticket line must be evaluated for consignment before a deposit structure is agreed. Deposits are the fallback, not the default.
-
Reorder gate. Automatic reorder points are suppressed for any SKU below the GMROI floor or tracking behind breakpoint. Aging-blind reordering is the single most common way capital gets stranded.
-
Markdown gate. When a SKU misses its breakpoint clear window, it goes to a decisive markdown on a set schedule — not a manager's month-by-month judgment call.
-
Redeployment gate. Capital freed by markdowns is explicitly earmarked for above-floor SKUs before it disappears into general cash. Freed capital that isn't redeployed on purpose gets re-stranded within a quarter.
The workflow in plain terms: demand read feeds the breakpoint, the breakpoint gates the buy, the financing structure sets the cash exposure, the shared dashboard tracks aging against the breakpoint, and a missed breakpoint triggers a markdown that feeds capital back into the buy gate. It's a closed loop — decisions on one end change the numbers on the other, in the same system, in near real time.
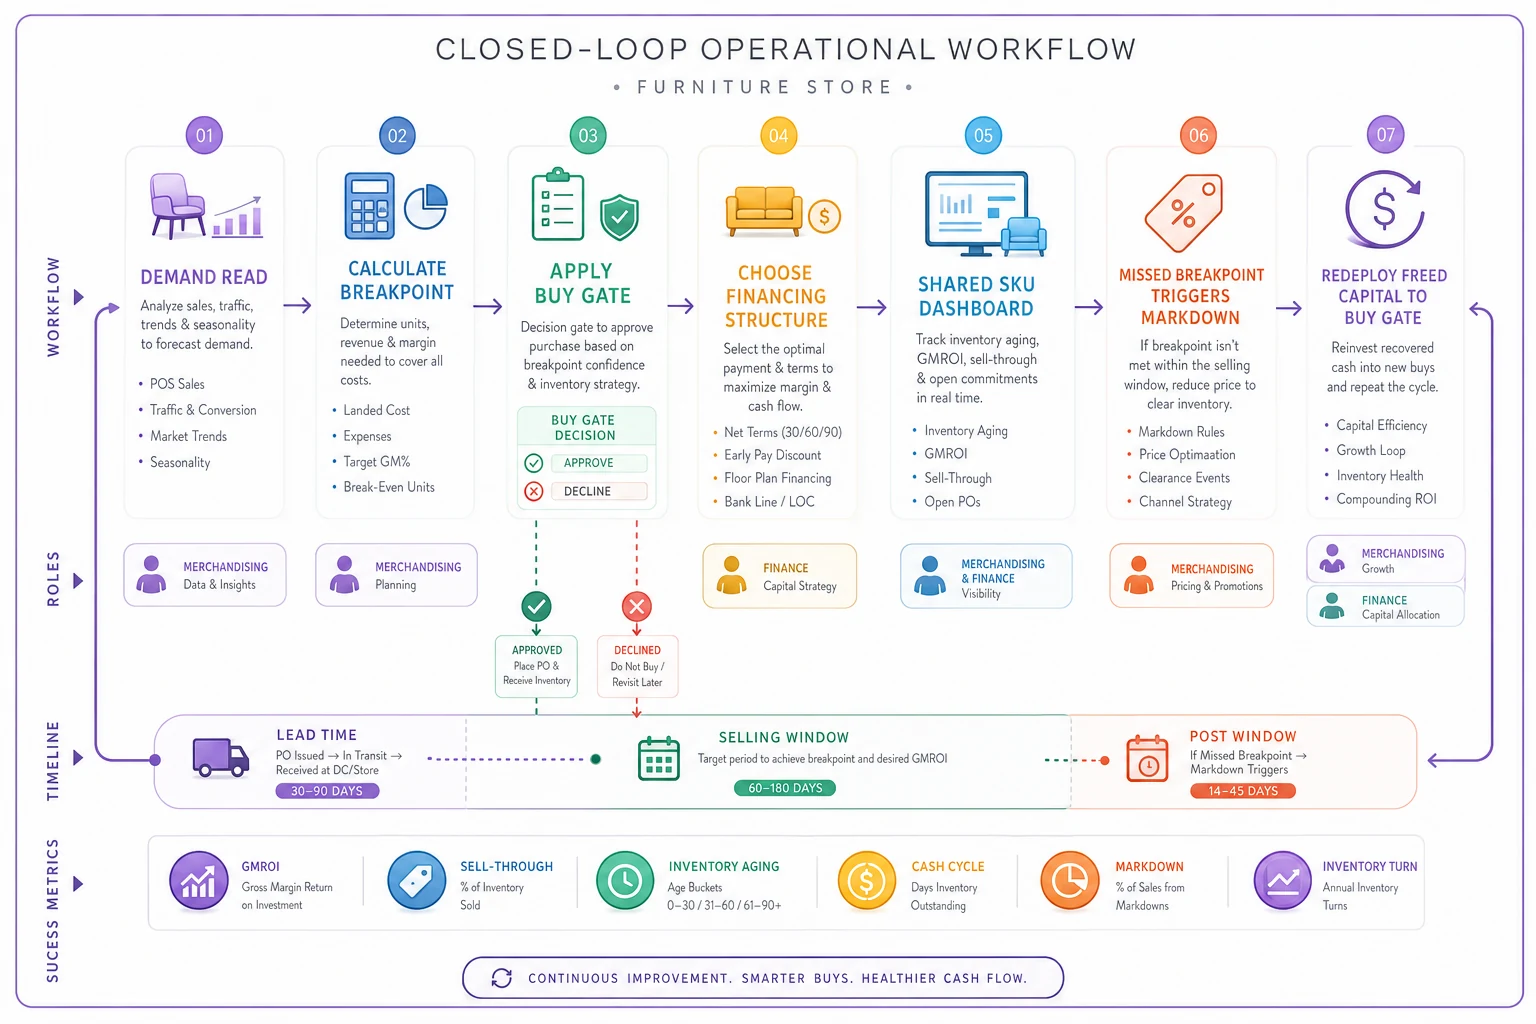
This diagram shows the gates and the loop so teams can see how a missed breakpoint becomes a markdown and then redeployment back into buys.
Where this breaks down at scale
At one location with a few hundred SKUs, a sharp buyer can hold most of this in their head. The model just formalizes their instincts. The trouble starts when you're running multiple locations, an online channel, and a few hundred more SKUs — because now the number of buy, financing, and markdown decisions per week exceeds what any person can reasonably track against breakpoints manually.
That's the transition where spreadsheet-based cash management quietly fails. Not because the math gets harder — it doesn't — but because the coordination becomes impossible. Merchandising is reordering on one set of numbers, finance is watching cash-at-risk on another, and by the time the two reconcile at month-end, three bad POs have already been placed and two SKUs have aged past the point where an early markdown would have helped.
This is where operational software that computes GMROI, breakpoints, and cash-at-risk from live SKU data starts to pay for itself — not because of the automation for its own sake, but because reorder suppression happens the moment a SKU drops below floor, the markdown clock starts on schedule without a manager's intervention, and finance and merchandising are finally looking at the same cash-at-risk number instead of arguing over two different spreadsheets. When decisions are moving faster than anyone can reconcile them manually, the system has to hold the model, not the buyer's memory.
Pulling it together
The furniture inventory-to-capital model isn't really about inventory. It's about treating every SKU as a specific claim on your working capital, and refusing to let capital sit in claims that don't pay it back fast enough. Margin tells you what a sale earns. Turn tells you how often that dollar comes home. Cash-at-risk tells you what's exposed right now. And the breakpoint tells you, before you ever place the order, whether the math even works.
The stores that stay liquid aren't the ones with the highest margins. They're the ones who never let a good-looking, slow-turning SKU freeze the capital their fast-movers need to keep running. Build the breakpoint into your buys, put a GMROI floor on your reorders, use consignment where the risk is highest, mark down decisively instead of drip by drip, and give merchandising and finance one shared view of the same cash. Do that, and the "profitable but broke" problem — the one that never shows up on the P&L — mostly stops happening.
The furniture inventory-to-capital model isn't really about inventory. It's about treating every SKU as a specific claim on your working capital, and refusing to let capital sit in claims that don't pay it back fast enough. Margin tells you what a sale earns. Turn tells you how often that dollar comes home. Cash-at-risk tells you what's exposed right now. And the breakpoint tells you, before you ever place the order, whether the math even works.
Ready to elevate your furniture business?
Join 500+ furniture retailers using Hosyly to increase efficiency, improve customer satisfaction, and grow revenue.