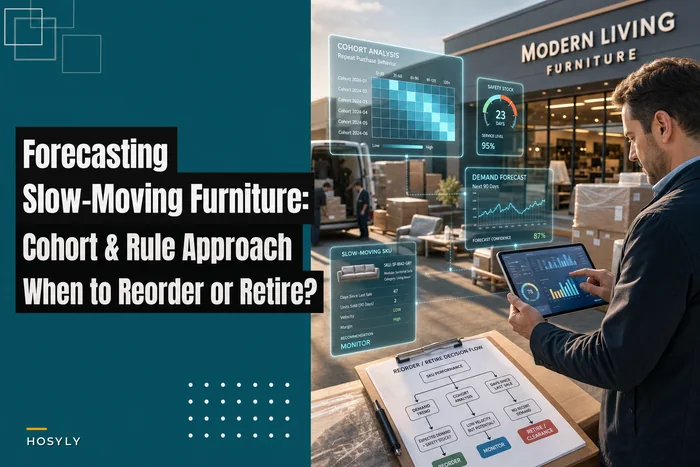



Most furniture retailers don't have a forecasting problem. They have a signal fragmentation problem. The information that predicts what you'll sell in eight weeks already exists inside your business — it's scattered across a quoting tool, a POS, a returns log, your website analytics, and the memory of whoever's been working the floor the longest. Nobody has stitched it together, so buyers end up ordering off gut feel and last year's sales, and then everyone acts surprised when the sectional in "Storm Grey" sells out while three pallets of "Ash" sit in the warehouse eating capital.
This is a systems piece, not a tips piece. The goal is to show how demand signals should flow into supply decisions through a governed pipeline — with validation gates, human checkpoints, and safe automated actions — so the whole thing scales without turning into a spreadsheet graveyard. If you've been treating forecasting as a monthly ritual instead of a continuous data flow, this is the reframe.
Why furniture demand signals are different (and why generic forecasting fails)
Long consideration windows. Someone browses a dining set in March, comes into the showroom in April, requests a quote in May, and buys in June. By the time the sale registers, the intent signal is three months stale. If your forecast only reads closed sales, you're always looking at demand that already happened.
Quotes are the real leading indicator. In most furniture businesses, quote-to-close rates on high-ticket items run somewhere between 25% and 45% depending on the category and the salesperson. That means quote volume — not sales volume — is your earliest reliable read on where demand is heading. Most retailers never feed quote data into their ordering logic at all.
Returns and cancellations carry hidden information. A spike in returns on a specific fabric or finish isn't just a service headache. It's telling you the online photos misrepresent the product, or the color runs darker than the swatch. That signal should adjust future orders and trigger a merchandising fix. Instead it usually dies inside a customer-service inbox.
A furniture demand data platform exists to catch all of these signals early, weight them properly, and route them into supply decisions before the demand curve moves out from under you. The hard part isn't the math. It's the plumbing and the governance.
The four signals worth stitching together
Before you build any pipeline, you need to know what's actually predictive. Across furniture operations, four signal families do most of the work.
Eliminate inventory headaches and order delays.
Hosyly streamlines your furniture orders and stock management for seamless store operations.
- Real-time inventory tracking
- Automated order processing
- Customer notifications & engagement
No credit card required
| Signal | What it tells you | Lead time before sale | Common mistake |
|---|---|---|---|
| Quotes & saved carts | Genuine purchase intent, config preferences | 2–10 weeks | Treated as sales admin, never analyzed in aggregate |
| Showroom engagement | Which floor samples drive conversations and touches | 1–6 weeks | Not tracked at all beyond foot traffic |
| Returns & cancellations | Product/expectation mismatch, quality issues | Trailing, but predictive of future churn | Logged as service tickets, disconnected from buying |
| Search & site behavior | Emerging interest, unmet demand, out-of-stock frustration | 3–12 weeks | Marketing owns it; ops never sees it |
The interesting part is what happens when you combine them. Search interest rising plus quote volume rising plus low return rate on that SKU is about as clean a "buy more" signal as furniture retail gives you. Search interest rising while quotes stay flat usually means a pricing or availability problem, not real demand — order against that and you'll overstock.
That distinction — separating interest from convertible intent — is where a lot of retailers lose money. Traffic is not demand. Quotes with follow-through are.
Where the signal pipeline breaks at scale
A single-location store can get away with a manager who "just knows." The wheels come off when you add a second showroom, a website, or a B2B trade channel, because now the same SKU is generating signals in four places and nobody owns the combined picture.
-
One location Buyer reads POS reports monthly, adjusts orders by feel. Works fine, barely.
-
Two-plus locations Location A sells out of a SKU while Location B has eight sitting on the floor. Neither buyer sees the other's velocity. Transfers happen too late.
-
Adding online Web search and cart data live in a totally separate system. The person ordering inventory has never looked at it. Online demand and showroom demand get forecast as if they're the same customer, which they aren't.
-
Adding trade/B2B A single trade order for 20 units distorts the whole demand read. The forecast now thinks that SKU is a bestseller and reorders heavily, right before the trade channel goes quiet for a quarter.
Every one of these is a coordination failure, not an analysis failure. The data was there. The pipeline to combine and govern it wasn't. This is closely tied to the master-data discipline behind a minimal SKU data spec for bulky furniture — if your SKUs aren't clean and consistently identified across channels, none of the signal-stitching works, because you can't tell that the "grey sectional" online is the same item as the one on the floor.
Building the governed pipeline: validation gates and human checkpoints
When people hear "data platform" the instinct is to imagine a fully automated system that reorders on its own. For furniture, that's a mistake. High-ticket, long-lead inventory means one bad automated order can lock up tens of thousands in capital for months. The right design is a pipeline that automates the boring 80% and forces a human decision on the risky 20%.
Think of it as three layers with gates between them.
Layer 1: Ingestion and validation
-
SKU reconciliation — is this signal mapped to a real, current SKU? Kill orphaned or discontinued SKU signals.
-
Anomaly screening — did quote volume 5x overnight? Flag it as a possible trade order or data error; don't feed it straight into the forecast.
-
Channel tagging — showroom vs online vs trade, kept separate so one channel can't silently distort another.
-
Return-reason coding — was the return quality, expectation mismatch, or logistics damage? Uncoded returns get held for review.
Signals that fail a gate don't get discarded silently — they get queued for a human to look at. That's the part most homemade spreadsheet setups skip, and it's why their forecasts drift.
Layer 2: Model and scoring
Cleaned signals feed a demand score per SKU that blends the four signal families with appropriate weights. Slow-moving high-ticket items need different logic than accessories — you can't forecast a $4,000 armoire the same way you forecast throw pillows. The cohort-and-rule thinking laid out in forecasting slow-moving, high-ticket furniture SKUs matters a lot here, because for low-velocity items you're often working with a handful of data points and rules beat pure statistics.
Layer 3: Action with human-in-the-loop
-
Auto-approve zone Low-value, high-turn, short-lead accessories and consumables. Replenishment fires automatically within preset min/max bands.
-
Review zone Mid-value items, or any order above a spend threshold, get proposed to a buyer with the supporting signals attached. The buyer approves, adjusts, or rejects.
-
Escalation zone New SKUs, long-lead orders, or anything flagged by anomaly screening go to a merchandiser-plus-ops sign-off. Two eyes, because the capital risk is real.
The key design principle: automation handles frequency and consistency, humans handle judgment and risk. A buyer who used to spend three days a month keying reorders now spends that time reviewing flagged decisions that actually matter.
How a signal moves through the pipeline — from raw input to purchase order:
> Raw signal ingested (POS / quote / web / return) → SKU reconciliation gate → Anomaly screening gate → Channel tagging → Demand scoring model → Action tier assigned (auto / review / escalate) → Human checkpoint (where required) → Purchase order proposed or fired
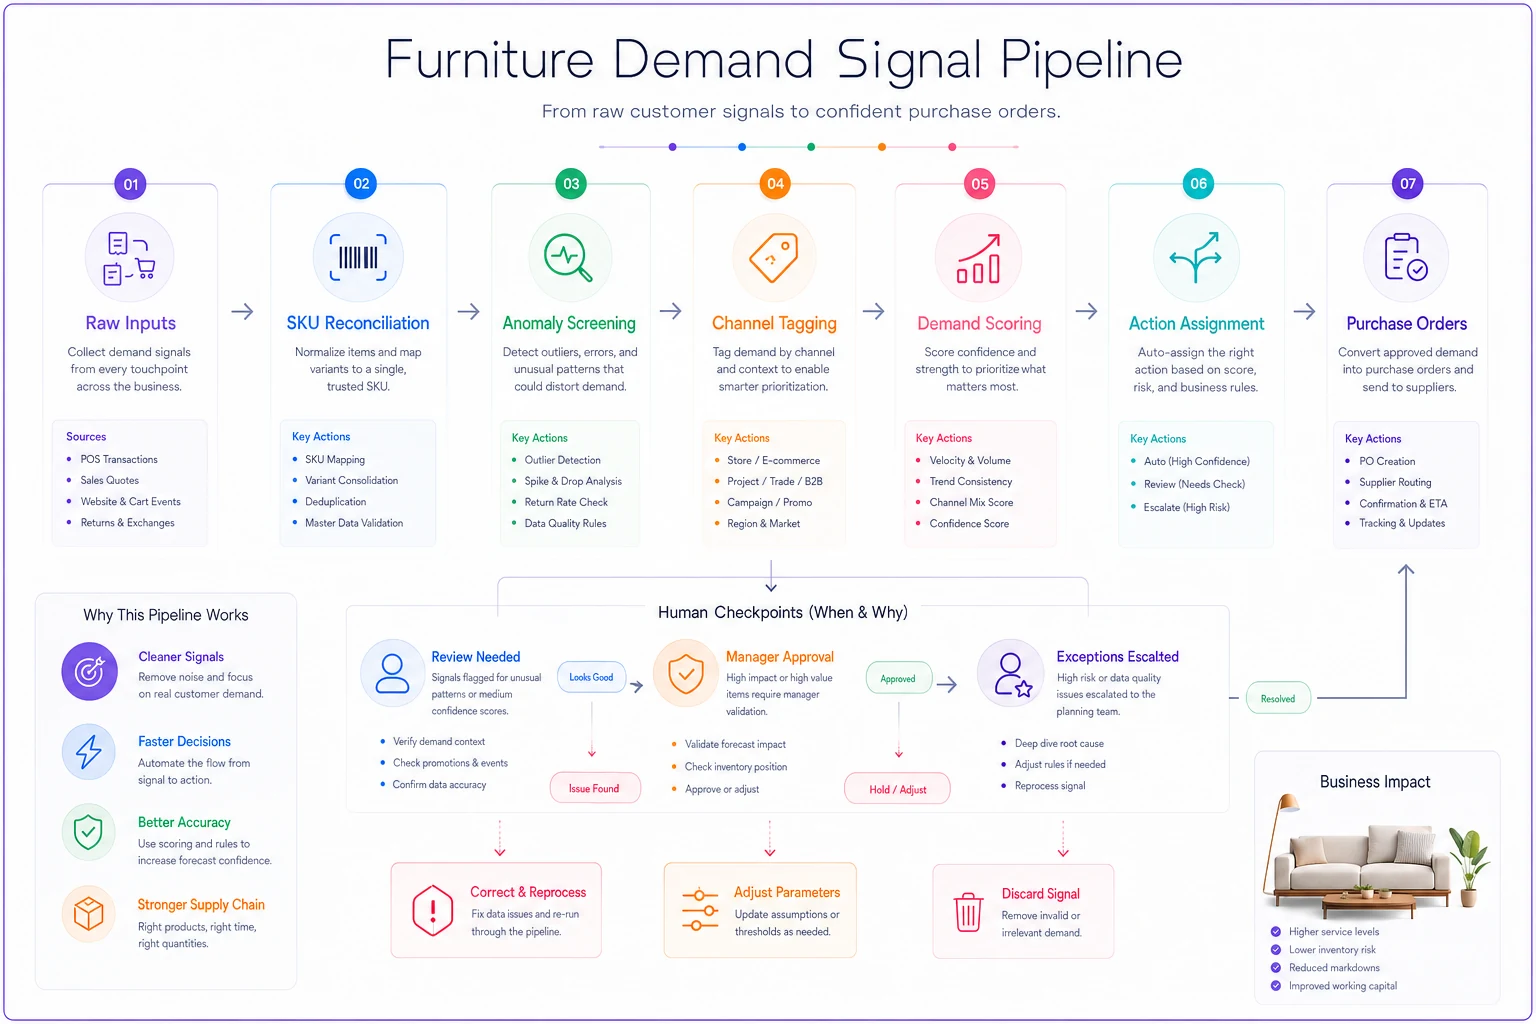
Visual of that flow.
Safe automated replenishment: what to automate and what never to
Automated replenishment is great right up until it quietly commits you to inventory you can't move. The line between safe and dangerous is mostly about lead time and unit cost.
Safe to automate:
-
Fast-moving, low-cost accessories with reliable suppliers
-
Spare parts and consumables within tight min/max bands
-
Reorders where lead time is short enough to correct a mistake fast
Never fully automate:
-
Long-lead imported goods (a wrong call is locked in for months)
-
New or seasonal lines without sell-through history
-
Anything a single trade order could be distorting
-
SKUs with a rising return rate — never reorder into a quality problem
Every automated action needs a circuit breaker: a spend cap, a per-SKU quantity ceiling, and a rule that pauses automation the moment a signal looks anomalous. The whole point of automating is to reduce manual keystrokes without removing the guardrails. If you can't explain to your CFO exactly what conditions trigger an automatic order, you've automated too much.
Tie automation thresholds to lead time and unit cost so long-lead, high-cost SKUs remain under human review.
Because these decisions tie directly to cash, the replenishment logic should connect to your working-capital view. The relationship between what you order and what it locks up is exactly the tension mapped out in the inventory-to-capital model for furniture retailers — a demand platform that ignores capital constraints will happily recommend orders you can't afford to fund.
KPIs and dashboards that actually get used
Dashboards fail when they're built for reporting instead of for decisions. Merchandisers and ops people don't need forty metrics; they need the handful that change what they do this week. Split them by role.
Merchandiser dashboard — what to buy and display:
-
Quote-to-close rate by SKU and category
-
Demand score trend (rising / flat / falling) per SKU
-
Return rate by reason code, flagged when above threshold
-
Search-to-quote conversion (interest that's actually converting)
-
Floor sample engagement vs conversion
Ops / buyer dashboard — how much and when:
-
Weeks of cover by SKU and location
-
Sell-through vs plan for new lines
-
Reorder actions pending review (the work queue)
-
Auto-replenishment fired vs paused, with reasons
-
Capital committed to open POs
A dashboard nobody argues over is usually a dashboard nobody uses. The ones that work create productive friction — a merchandiser looks at a rising return rate on a top-seller and immediately asks whether the online photos are lying, or whether a supplier changed the fabric batch. That's the point. The metric should provoke a specific question with a specific owner.
A real scenario: two showrooms, one blind spot
A mid-sized retailer running two showrooms and a growing website was carrying roughly $600k in inventory and consistently frustrated — showroom stockouts on popular configs, and a warehouse full of slow finishes. Their buyer worked off monthly POS exports and had never once looked at website search or quote data, which lived with the marketing person in a different tool.
When they started routing quote data and site search into the same view as sales, two things jumped out fast. One sofa in a specific performance fabric was being quoted roughly three times more often than it was selling — a fit and pricing issue on the config page, not a demand problem. A dining collection had strong, steady search interest but was chronically understocked because it had a mediocre sales history from a previous, poorly-photographed listing.
They stopped auto-reordering the over-quoted-under-selling sofa, fixed the config page, and increased the dining order. Over the next two quarters, showroom stockouts on their top-20 SKUs dropped noticeably, and they trimmed somewhere in the range of $70k–$90k of dead inventory by not reordering finishes the demand score never supported. Nothing exotic happened. They just stopped forecasting off a single lagging signal.
When this system makes sense — and when it doesn't
It makes sense when:
-
You run more than one location, or a showroom plus online
-
You carry meaningful long-lead or high-ticket inventory
-
Your buyer is drowning in manual reorder work
-
Quote and search data exist but nobody in ops ever sees them
It's premature when:
-
You're a single small showroom where one person genuinely sees every signal
-
Your SKU data is a mess — fix master data first, or you'll be stitching garbage to garbage
-
You don't have clean quote or return records yet
That second point deserves emphasis. Retailers rush to build forecasting on top of inconsistent SKU identifiers and channel data, and the platform faithfully produces confident, wrong answers. Get the foundation clean before you automate on top of it. A governed pipeline amplifies whatever data quality you feed it — in both directions.
The bigger point
The retailers who win at this aren't the ones with the fanciest model. They're the ones who treat demand as a continuous flow of early signals rather than a monthly sales report, and who put real governance between those signals and the purchase orders. Quotes tell you what's coming. Search tells you what people can't find. Returns tell you what's broken. Sales just confirm what already happened.
Stitch those together, gate them properly, automate the safe stuff, and force a human decision where the capital risk lives — and you go from ordering against the past to ordering against the near future. That shift is the whole game, and most of the pieces are already sitting in your systems, waiting to be connected.
Ready to elevate your furniture business?
Join 500+ furniture retailers using Hosyly to increase efficiency, improve customer satisfaction, and grow revenue.