

Most furniture stores handle slow-movers wrong. They either overstock expensive pieces that sit for months, or they're constantly out of the one SKU a customer actually wants. The problem gets worse with high-ticket items—that $6,500 leather sectional might only sell three times a year, but missing those sales still hurts badly.
Traditional forecasting breaks down completely for these SKUs. Moving averages assume consistent demand. Seasonal models need years of data you don't have. Standard reorder points treat a $400 accent chair the same as a $4,000 dining set.
After building operational systems for furniture retailers across the country, one pattern keeps showing up: stores need a completely different approach for slow-moving, expensive inventory. Not complex algorithms—practical rules combined with customer behavior signals.
The fundamental problem with furniture forecasting
Furniture creates a genuinely weird inventory challenge. A convenience store knows they'll sell 40-50 energy drinks tomorrow. A furniture store might sell zero sofas for three weeks, then four in one weekend.
The math gets brutal with expensive pieces. That Italian marble dining table at $7,200? You sold one in March, nothing April through July, then two in August. Traditional forecasting says you need 0.4 units in stock. Reality says you either have one or you don't.
Here's what typically happens. The store manager looks at last year's sales—maybe 8 units total—divides by 12, adds some buffer, and orders accordingly. Except furniture doesn't work that way. Those 8 sales might have been:
-
3 during a Memorial Day promotion
-
2 from a designer buying for a project
-
2 random walk-ins spread across six months
-
1 from someone who waited four months for that exact piece
Standard safety stock calculations assume demand follows a normal distribution. But when you're selling 6-10 units a year of something, there's no distribution—just individual purchase events that might be completely unrelated to each other.
Building cohort tracking for sparse data
Cohort analysis usually requires hundreds of data points. Furniture stores need it to work with dozens. The trick is grouping SKUs intelligently and tracking behavior patterns instead of just counting sales.
Eliminate inventory headaches and order delays.
Hosyly streamlines your furniture orders and stock management for seamless store operations.
- Real-time inventory tracking
- Automated order processing
- Customer notifications & engagement
No credit card required
Start with price-category cohorts. Don't just use "dining tables" as a category—split them:
| Price-category cohorts |
|---|
| Entry dining ($800-$1,500): First-home buyers, apartment dwellers |
| Mid-tier dining ($1,500-$3,500): Family upgrades, style changes |
| Premium dining ($3,500+): Complete renovations, luxury buyers |
Within each cohort, track engagement signals, not just sales:
-
Floor touches (customer physically interacted with a piece)
-
Serious inquiries (asked about delivery, dimensions, customization)
-
Quote requests (wanted formal pricing—usually for spouse approval)
-
Return visits (came back specifically to see that piece again)
A traditional system would show that mahogany dresser hasn't sold in four months. Cohort tracking shows six serious inquiries, two quote requests, and someone who's visited it three times. That's not a dead SKU. That's a piece building toward a sale.
Map these patterns across 18-24 months and real insights emerge. That contemporary bedroom set that seems dead? It actually clusters sales in September-October (new home purchases) and January-February (new year renovations). The zeros in between aren't lack of demand—they're predictable gaps.
Quote requests and search signals as leading indicators
Sales data for slow-movers is always backwards-looking. By the time you realize something's selling, you're already out of stock. Tracking intent signals that happen before purchases is the only way around that.
Physical showroom signals tell you what's about to sell:
-
Multiple customers asking about the same unavailable SKU
-
Customers photographing specific pieces repeatedly
-
Questions about customization options (fabric, finish, size)
-
Requests for items similar to a display piece
Digital signals often predict sales 2-3 weeks out:
-
Website searches for specific SKU names or descriptions
-
Configuration tool usage (building custom versions)
-
Wishlist additions
-
Quote calculator interactions
-
Dimension checking on product pages
A real pattern from a mid-size furniture retailer: their $3,800 modular sectional sold unpredictably—sometimes twice a month, sometimes nothing for eight weeks. After tracking signals, they found every sale followed the same sequence. Website configuration first. Showroom visit within 10 days. Spouse visit within another week. Then purchase.
Once you identify that pattern, you can actually forecast the thing. Four configuration sessions this week on that sectional? You'll likely need inventory within 15-20 days.
Rules-based safety stock for expensive inventory
Safety stock formulas assume carrying cost is linear. Furniture has weird economics. An extra $500 accent chair costs maybe $20/month to carry. An extra $5,000 bedroom set costs $200/month—plus it locks up $5,000 you could spend buying inventory that actually moves.
Instead of mathematical safety stock, use operational rules based on lead times and margins:
For 45%+ margin items with 4-6 week lead times:
-
Keep 1 in stock if you get 2+ serious inquiries monthly
-
Keep 0 in stock but display if you get 1 inquiry monthly
-
Remove from display if no inquiries in 60 days
For 30-45% margin items with 6-10 week lead times:
-
Keep 1 in stock only if selling 1+ monthly
-
Otherwise display only, order on commitment
-
Require 25% deposit for orders
For sub-30% margin items with any lead time:
-
Never stock, only display
-
Order only with 50% non-refundable deposit
-
Consider dropping unless selling 2+ monthly
These rules prevent the classic furniture store problem: $100,000 tied up in beautiful pieces nobody's buying while you're constantly out of the $2,000 recliners that actually move.
The reorder decision flowchart
Every slow-moving SKU needs a monthly decision: reorder, hold, or retire. Here's the exact decision flow:
Check engagement first:
-
In last 30 days, did this SKU get
- 2+ serious inquiries? → Continue to next check - 1 inquiry? → Check 60-day window - 0 inquiries? → Check 90-day window
Check margin and velocity:
-
Margin above 40% AND sold 1+ in last 90 days? → Reorder
-
Margin above 40% BUT no sales in 90 days? → Hold, monitor weekly
-
Margin 25-40% AND sold 2+ in last 90 days? → Reorder
-
Margin 25-40% AND sold 1 in last 90 days? → Order on deposit only
-
Margin below 25%? → Retire unless presold
Check competitive position:
-
Only store in area carrying this style? → Lower reorder threshold by 1 unit
-
Three+ competitors have similar? → Raise reorder threshold by 1 unit
-
Online-only competitors? → Maintain standard threshold
Check seasonal patterns:
-
Approaching historical strong season? → Order 2 weeks earlier
-
Entering historical dead period? → Skip reorder cycle
-
No clear pattern? → Use standard rules
This flowchart prevents emotional decisions. That gorgeous teak console might be the owner's favorite piece on the floor, but if it hasn't had an inquiry in 90 days and sits at 22% margin, it needs to go.
Here's a simple visual representation of the decision workflow.
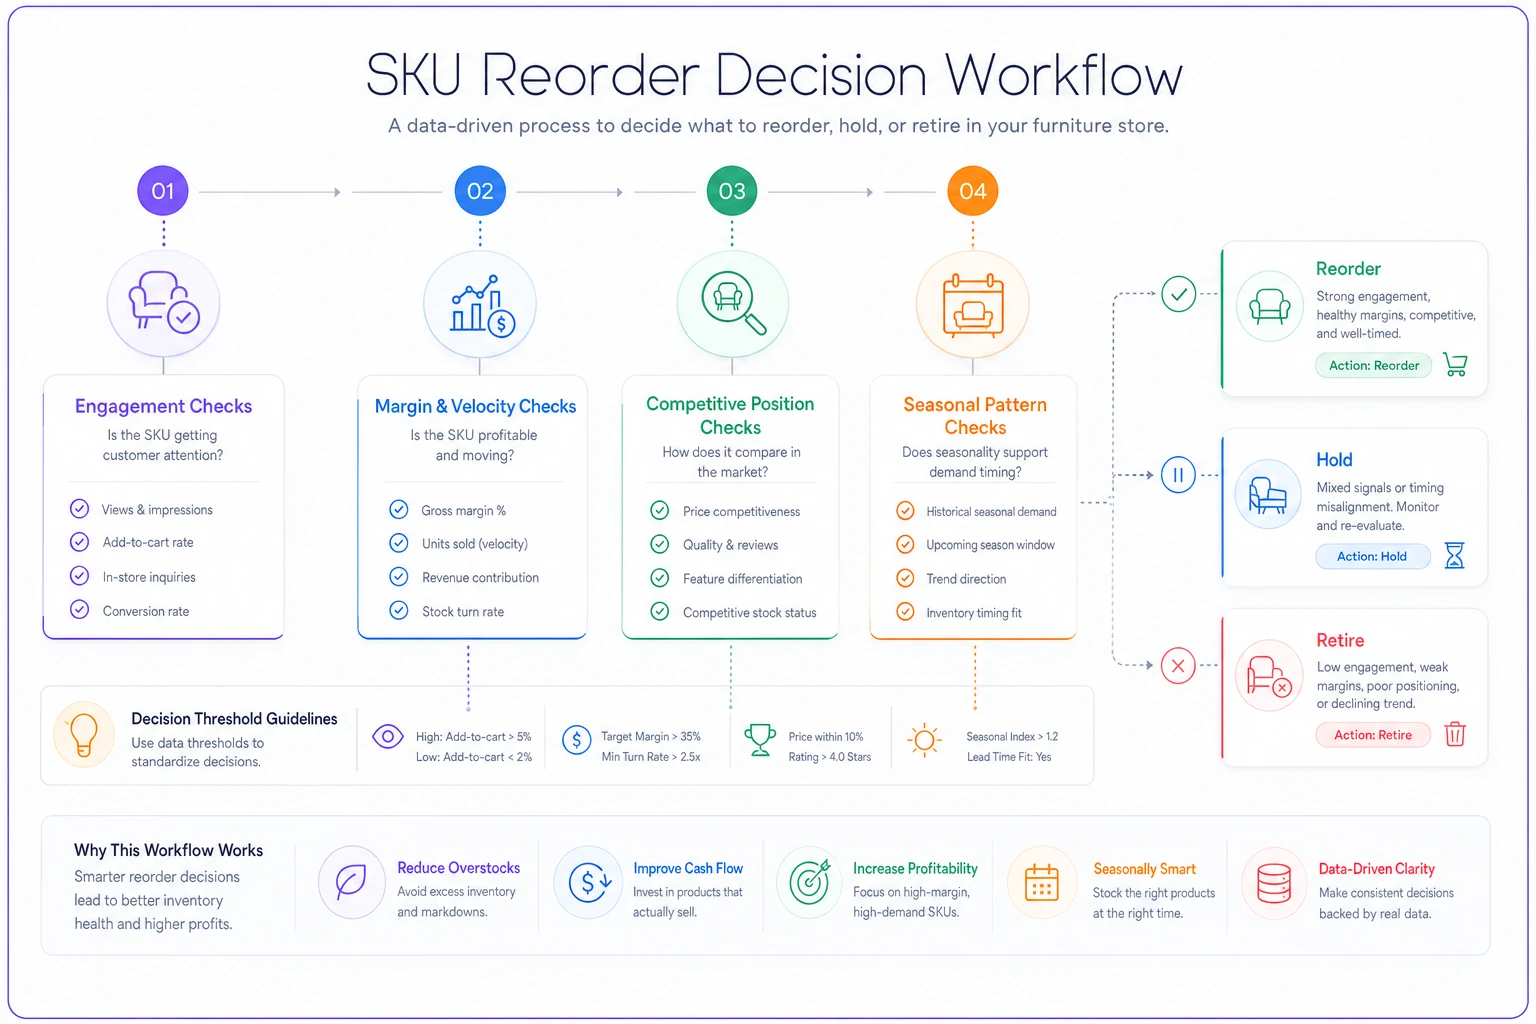
Use this flowchart monthly to keep decisions consistent and data-driven.
Worked example: The $4,500 sectional problem
Take a real SKU decision. You have a $4,500 gray modular sectional. Cost is $2,700 (40% margin). Lead time is 7 weeks. Sales history:
-
2 in January
-
0 in February
-
1 in March
-
0 in April
-
0 in May
-
1 in June
Traditional forecasting says you need 0.67 units per month, so keep one in stock. But that's missing critical context.
Checking engagement signals:
-
January sales
Both came from November/December inquiries
-
March sale
Customer visited four times over six weeks
-
June sale
Bought during Father's Day promotion
Checking search and quote data:
-
12 product page views monthly average
-
3 configuration sessions in last 30 days
-
2 quote requests in last 15 days
Checking cohort patterns (similar sectionals $4,000-5,000):
-
Cluster around holidays (Memorial Day, July 4th, Labor Day)
-
Dead zones in February and September
-
Average 2-3 touches before purchase
Current date is late June. July 4th is approaching—a historical strong period. You have 2 recent quotes and 3 configuration sessions. The cohort typically sees an uptick around patriotic holidays.
Decision: Reorder 1 unit immediately for July 4th weekend availability.
Without the cohort and signal analysis, you might have skipped it based on the recent zeros. With it, you can see demand building toward the holiday.
When retiring beats reordering
Sometimes the smartest reorder decision is no reorder at all. Furniture stores struggle with this because of sunk cost psychology and anxiety about showroom gaps.
Clear retirement triggers:
-
No inquiries for 90+ days
-
Margin degraded below 25% (supplier price went up, market price didn't)
-
Similar SKU significantly outperforming
-
Supplier reliability issues emerged
-
Style trending out (check whether Pinterest/Instagram saves are dropping)
The tricky part is managing the retirement without disrupting sales. Pull a piece cold and customers notice the gap. Slap a "clearance—discontinued!" sign on it and you might crater the perceived value of everything nearby.
Better approach: transition selling. Move the retiring piece to less prominent floor space. Shift signage emphasis to the successor SKU. Let it sell through naturally while you build interest in the replacement. Track anyone who specifically asks about it—those are warm leads for the new piece once you're out.
Implementation reality check
This system needs three things most furniture stores don't have: consistent signal tracking, weekly review discipline, and the willingness to act on data instead of gut feel.
Signal tracking doesn't require fancy software at the start. A simple spreadsheet with daily entries works:
-
SKU
-
Date
-
Signal type (inquiry, quote, configuration, etc.)
-
Customer identifier if possible
-
Notes
After 60-90 days, patterns become obvious. That contemporary dining set you thought was dead? Turns out it gets serious attention every time someone buys the matching buffet. The connection was always there—nobody was tracking it.
The weekly review is non-negotiable. Slow-moving inventory problems compound. Every week you delay a reorder or retirement decision costs margin. Pick a day, block 90 minutes, review every SKU over $2,000 using the flowchart.
Where AI-powered systems actually help
The real challenge with this approach is scale. Tracking dozens of signals across hundreds of SKUs, then connecting patterns a human would miss—that's where operational software starts making a genuine difference.
Modern furniture store management platforms can automatically track customer interactions across both digital and in-store touchpoints. They connect website behavior to showroom visits, flag when signal patterns match previous purchase cycles, and alert you when a slow-mover starts showing buying indicators. Instead of manually scanning spreadsheets, you get a notification: "Three configurations on SKU-4521 this week, matches previous purchase pattern."
AI automation helps most with the cohort analysis. Instead of manually grouping SKUs and calculating patterns, the system identifies which products behave similarly and flags demand spikes based on past cycles. It can factor in external signals too—local housing starts, competitor inventory levels, seasonal patterns.
The real value isn't replacing your judgment. It's making sure you have complete information when you exercise it. The system flags that your $5,500 leather sectional is getting unusual attention. You still decide whether to reorder based on margin, supplier relations, and showroom strategy. But you're making that call with full context instead of last month's sales report.
Making slow-movers profitable
High-ticket, slow-moving inventory doesn't have to be a cash drain. The stores that handle it well aren't necessarily smarter—they just understand it's not about predicting exact demand. It's about recognizing patterns and responding quickly.
Track signals, not just sales. Group SKUs into behavioral cohorts. Use rules based on margin and lead time, not mathematical safety stock. Make weekly decisions with a consistent flowchart. And know when retiring a beautiful piece is smarter than reordering it.
Most furniture stores guess wrong on slow-movers because they're using the wrong tools. Moving averages and reorder points work fine for items selling daily. For that $8,000 sectional selling quarterly, you need a completely different approach.
Start with your ten most expensive SKUs. Track every interaction for 30 days. Apply the decision flowchart. You'll quickly see which pieces deserve inventory investment and which are just expensive showroom decoration.
Ready to elevate your furniture business?
Join 500+ furniture retailers using Hosyly to increase efficiency, improve customer satisfaction, and grow revenue.