



Most furniture retailers price a sofa, a bed, or a dining set like it's a one-time transaction. You buy it for X, you sell it for Y, the margin is the gap. Done. But that math quietly ignores most of what happens after the sale — the protection plan the customer did or didn't buy, the service call eighteen months later, the replacement leg or drawer glide you ship, the financing fee that ate a chunk of your margin on the way out the door.
When you fold all of that into a single number — the profit a customer generates over their whole relationship with you, not just at checkout — your assortment and pricing decisions start to look very different. Some of your "best sellers" are barely breaking even once you account for repairs and financing. Some of your "boring" mid-tier SKUs are quietly carrying the store because of attach rates and parts revenue.
This is a worked model for customer lifetime profit furniture retailers can actually use to decide what to stock, what to price up, and what to quietly retire. It's not a theory piece. It's the numbers, the thresholds, and the governance rules that keep the whole thing honest.
Why gross margin at checkout lies to you
A pattern that shows up constantly: a retailer ranks SKUs by unit gross margin, promotes the top of that list, and buys deeper into it every season. Looks rational. Except unit gross margin is blind to four things that materially change the real economics of a sale.
-
Attach rate — how often that SKU pulls in a protection plan, a rug, a mattress protector, a care kit, or a matching piece
-
Repair probability — how often the product comes back for a warranty claim or out-of-warranty service, and what that costs you to fulfill
-
BNPL / financing drag — the merchant fee you eat when the customer pays in installments, which on high-ticket furniture is far from trivial
-
Parts revenue — the margin you make selling replacement components, which for some categories is a genuine income stream and for others is a cost center
A sectional that sells at a 42% gross margin but carries a 9% repair rate, a 3.5% BNPL fee, and almost no attach can easily end up less profitable per customer than an accent chair at 35% margin that pulls in a protection plan two-thirds of the time and almost never comes back.
Checkout margin isn't useless. It's just the first number, not the final one. Lifetime profit is the final one.
The building blocks of a CLP number
Customer Lifetime Profit for a given SKU, in plain terms: CLP = Base unit margin + Attached-product margin − Expected service/repair cost + Parts revenue − Financing drag − Allocated post-sale handling Each term has a probability or rate baked into it. Here's how each one gets estimated in real operations.
Eliminate inventory headaches and order delays.
Hosyly streamlines your furniture orders and stock management for seamless store operations.
- Real-time inventory tracking
- Automated order processing
- Customer notifications & engagement
No credit card required
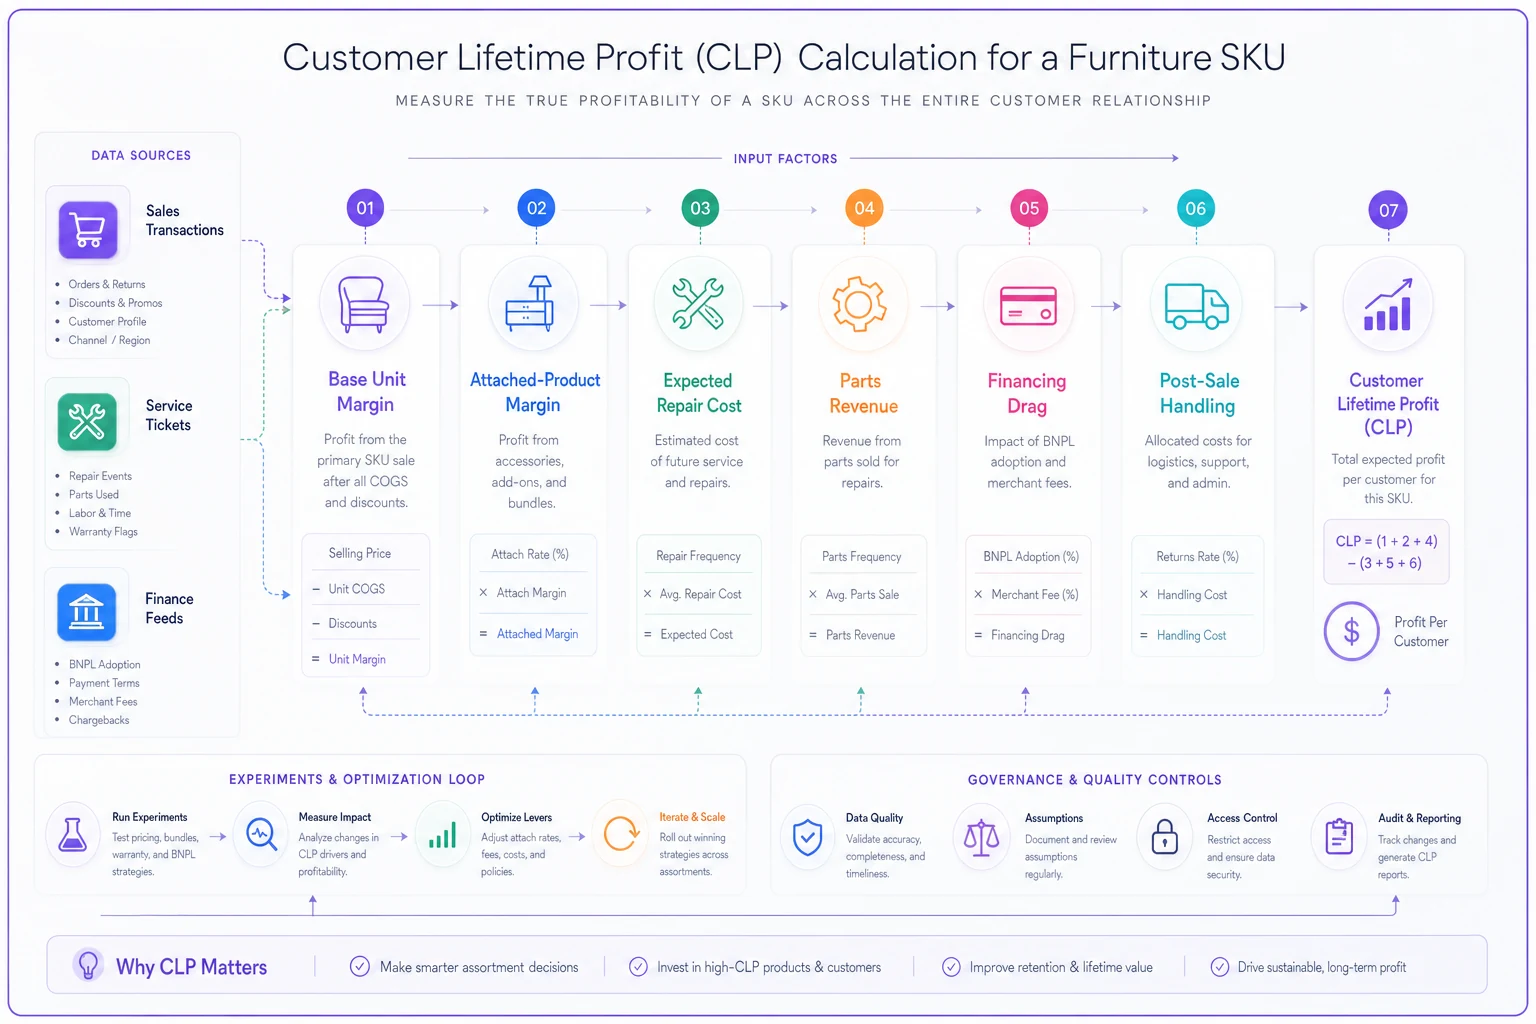
The diagram below shows the CLP calculation workflow and key inputs.
1. Base unit margin
Net selling price minus landed cost minus any delivery/install subsidy you're absorbing. Straightforward, but make sure delivery subsidies are in here — a lot of stores quietly eat $80–$150 of delivery cost on free-delivery promos and never attribute it back to the SKU.
2. Attached-product margin
Attach rate × average attached margin. If a bed frame pulls a mattress 55% of the time at an average $180 margin, that's roughly $99 of expected attached margin riding on every bed frame sold. This is where "low margin" anchor products earn their place in the assortment.
3. Expected service/repair cost
Repair probability × average repair cost. This is the term most retailers never quantify. If 8% of a recliner model comes back and the average service event (truck roll, labor, part) costs you $140, that's about $11.20 of expected cost per unit sold. Sounds small until you multiply by volume — and until you compare two SKUs where one has an 8% rate and the other has 2%.
If you've never built a repair-cost baseline, the spare-parts side of this is its own discipline. The logic for sizing spare-parts kits with min/max stocking and reorder triggers feeds directly into the repair-cost term here — you can't estimate expected service cost without knowing what a repair event actually consumes.
4. Parts revenue
For out-of-warranty service and DIY customers, replacement parts can be a margin line, not just a cost. Parts request rate × parts margin. A dining set where customers routinely buy replacement chair glides, extension leaves, or hardware kits might generate $8–$20 of parts margin per unit over its life. A well-run aftercare operation can turn this from a cost center into a revenue stream — the same thinking behind turning warranty claims into service revenue.
5. Financing drag
BNPL / installment adoption rate × merchant fee × average order value. On a $2,400 order with a 40% BNPL adoption rate and a 4% merchant fee, the expected drag is about $38.40 per order. On thin-margin categories this single term can flip a SKU from profitable to marginal. There's a deeper breakdown on structuring this without blowing up credit exposure in the piece on evaluating BNPL and installment options for high-ticket furniture.
6. Allocated post-sale handling
Returns handling, reassembly, customer-service time. Easy to hand-wave. A rough per-unit allocation based on category return rate and average handling time is enough to start — precision comes later.
A worked example: two SKUs that look identical on paper
Two SKUs, both priced around $1,800, both showing similar checkout margins. Watch what happens when you run them through the full model.
| Line item | SKU A: Fabric Sectional | SKU B: Leather Recliner Set |
|---|---|---|
| Net selling price | $1,800 | $1,800 |
| Landed cost | $1,050 | $1,120 |
| Delivery subsidy absorbed | $110 | $90 |
| Base unit margin | $640 | $590 |
| Attach rate | 25% | 60% |
| Avg attached margin | $120 | $160 |
| Expected attached margin | +$30 | +$96 |
| Repair probability | 11% | 4% |
| Avg repair cost | $165 | $130 |
| Expected repair cost | −$18.15 | −$5.20 |
| Parts request rate | 3% | 9% |
| Avg parts margin | $14 | $22 |
| Expected parts margin | +$0.42 | +$1.98 |
| BNPL adoption | 45% | 38% |
| Merchant fee | 4% | 4% |
| Financing drag | −$32.40 | −$27.36 |
| Post-sale handling allocation | −$22 | −$12 |
| Customer Lifetime Profit | ~$598 | ~$643 |
On checkout margin, SKU A looked better — $640 vs $590. On lifetime profit, SKU B wins by about $45 a unit, driven almost entirely by a much higher attach rate, lower repair exposure, and a real parts stream. Across 300 units a year, that's a swing of roughly $13k–$14k in real profit that the checkout-margin view completely hides.
That's the whole argument for this model in one table. The ranking flips.
Turning CLP into decision thresholds
A number is useless until it drives an action. The way to make CLP operational is to set thresholds that trigger specific merchandising and pricing moves.
-
Rank the assortment by CLP per unit and CLP per square foot. Per square foot matters because floor space is your real constraint — a high-CLP piece that needs a huge footprint may lose to a smaller one.
-
Flag any SKU where CLP is more than 20% below checkout margin. That gap means hidden costs (repairs, financing, handling) are eating the product. These are your "looks fine, bleeds quietly" items.
-
Flag any SKU where CLP is more than 15% above checkout margin. These are your under-promoted winners — usually attach-rate or parts-revenue heroes. Promote them, feature them, buy deeper.
-
For negative-gap SKUs, test three levers before retiring raise price to cover the drag, restructure financing (shorter terms, lower-fee provider), or improve attach through bundling.
-
Re-rank quarterly. Repair rates and attach rates drift as cohorts age and as you change suppliers.
The thresholds are deliberately generous (15–20%) because the input data is noisy at first. Tighten them as your repair and attach data matures.
Experiment templates: don't trust the model blindly
The biggest failure mode isn't building the model wrong — it's believing every number in it before you've tested it. Attach rates and repair probabilities especially need controlled experiments, not assumptions. Three templates worth running:
Experiment 1 — Attach-rate lift via bundling
-
Hypothesis
Bundling a care kit at point of sale raises attach from ~25% to ~40% on SKU A.
-
Setup
Run bundle offer on half your sales channels/associates for 6 weeks, hold the other half flat.
-
Measure
Attach rate, incremental attached margin, any effect on base conversion.
-
Decision rule
Roll out if attach lift adds more than $20/unit CLP without dropping base conversion by more than 2 points.
Experiment 2 — BNPL term restructuring
-
Hypothesis
Moving from a 4% 12-month plan to a 2.5% 6-month plan on mid-ticket SKUs lowers financing drag without hurting conversion.
-
Setup
A/B the financing options at checkout for 4–6 weeks.
-
Measure
BNPL adoption, conversion, cart abandonment, blended financing drag.
-
Decision rule
Keep the lower-fee option if conversion holds within 1.5 points and drag drops meaningfully.
Experiment 3 — Price-up to cover repair drag
-
Hypothesis
A 3–4% price increase on a high-repair SKU offsets its service cost without killing demand.
-
Setup
Stage the increase in one region or channel, hold a control.
-
Measure
Unit velocity, CLP per unit, CLP per square foot.
-
Decision rule
Keep the increase if CLP per square foot improves and velocity drops less than your margin gain.
Every input in your CLP model should eventually be backed by a real test, not a guess you made in a spreadsheet one afternoon.
Governance rules that keep the model from rotting
CLP models die one of two ways: nobody updates the inputs, or everybody games them.
-
One owner per input. Repair probability owned by service, attach rate owned by sales, financing drag owned by finance. No orphaned numbers.
-
Source-of-truth lock. Repair cost comes from actual service tickets, not estimates. Attach comes from transaction data, not what associates think they sell.
-
Refresh cadence. Attach and financing monthly, repair probability quarterly (it lags — warranty claims take time to materialize), parts revenue quarterly.
-
No single-input overrides pricing. A price change needs the full CLP recomputed, not just "margin looks low, bump it."
-
Cohort awareness. A SKU launched six months ago hasn't shown its real repair rate yet. Flag young SKUs as "incomplete data" so nobody retires a product before its repair curve is visible.
Automate data feeds from service tickets and transaction systems to keep CLP inputs current and reduce manual reconciliation.
That last rule matters more than it looks. Repair probability is a lagging metric. If you judge a new sofa line at month four, you'll see a flattering repair number that collapses by month eighteen. Plenty of retailers have doubled down on a SKU right before its failure rate showed up. Keeping these inputs clean across sales, service, and finance is genuinely hard when each team works in its own system and the numbers only get reconciled when someone asks. Operational software that centralizes service tickets, attach data, and financing fees into one view earns its keep here — not because it's clever, but because it kills the lag between "a repair happened" and "the model knows about it." When repair events, parts sales, and BNPL fees flow into the same place automatically, your CLP numbers stay current without a monthly fire drill of exporting four spreadsheets and hoping the dates line up.
When this model makes sense — and when it doesn't
When it's worth building: You carry 150+ active SKUs, you offer financing, and you run any kind of aftercare or service operation. That's the combination where hidden costs vary enough between products to change decisions. If your SKUs all have similar repair and attach profiles, checkout margin is probably good enough and CLP is overkill.
When it's a bad idea: If your repair and attach data is so thin or messy that every input is a guess, building an elaborate CLP model gives you false precision. Fix your data capture first — get clean service tickets and transaction-level attach data — then build the model. A confident number built on garbage is worse than an honest "we don't know yet."
Who should skip this entirely: A store doing low volume on a tight SKU count with no financing. The modeling overhead won't pay for itself. Spend that energy on turns and floor-space productivity instead.
A short real scenario
A regional retailer with two showrooms — roughly 220 active SKUs, financing on about 40% of orders — ranked their assortment the usual way, by checkout margin. Three of their top ten by margin turned out, once repair and financing drag were folded in, to be sitting near the bottom third on CLP. One bedroom set in particular looked like a 46% margin star and was actually barely clearing its service and financing costs because of a drawer-mechanism issue generating steady warranty claims.
They didn't retire it. They raised its price about 4%, switched the financing offer to a lower-fee shorter term, and added a care-kit bundle. Over the next two quarters the set's CLP went from essentially break-even to roughly $120–$140 per unit. The bigger win was quieter: they stopped buying deep into two other "high margin" SKUs that the CLP view flagged as drag, and redirected that open-to-buy toward two under-promoted attach heroes. Nothing dramatic month to month — but across the year, a noticeably healthier blended margin without raising prices across the board.
The takeaway
Checkout margin tells you what a product earns in the first ten minutes. Customer lifetime profit tells you what it earns over the whole relationship — and for furniture, where that relationship includes service calls, replacement parts, financing, and everything a customer buys alongside the main piece, the difference is big enough to reorder your entire assortment.
Build the model with honest inputs, set thresholds that trigger real pricing and merchandising moves, test the assumptions instead of trusting them, and put one owner on each number so it doesn't rot. Do that, and you stop being surprised by the products that looked great at the register and quietly cost you money for two years after.
Ready to elevate your furniture business?
Join 500+ furniture retailers using Hosyly to increase efficiency, improve customer satisfaction, and grow revenue.