

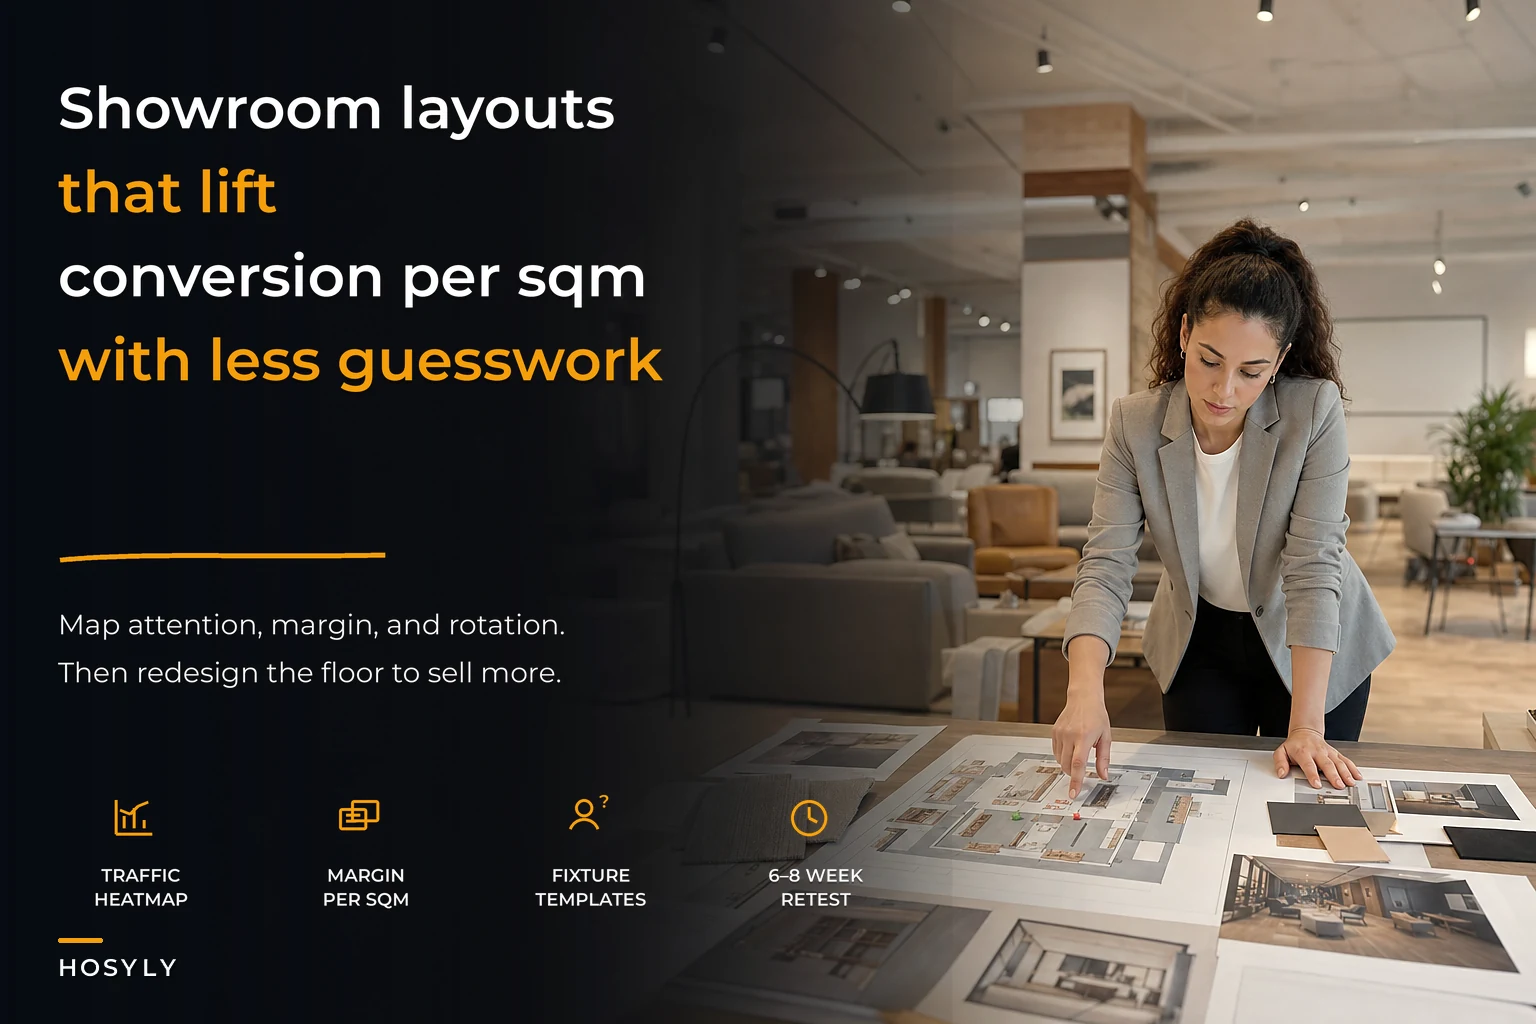

Most furniture retailers treat their showroom layout as a semi-permanent thing. You set it up when you sign the lease, maybe reshuffle around a holiday, and otherwise leave it alone until something obviously stops working. That's the mistake. Your floor plan is one of the few levers you control completely — no supplier, no carrier, no forecast involved — and it directly decides how much revenue each square meter earns.
The problem is that "good layout" gets treated like an aesthetic decision. Merchandisers argue about vignettes and sightlines. Meanwhile the actual math — traffic flow, dwell zones, sample rotation, conversion per sqm — sits in nobody's job description. So the store looks nice and quietly underperforms.
This piece is about treating the showroom as a system: how fixtures, sample rotation cadence, and spatial data connect, where that system breaks as you add SKUs or locations, and how to actually compute what a layout is earning you.
The unit that matters: conversion per sqm, not conversion rate
Retail people love conversion rate — visitors who buy divided by total visitors. For furniture it's almost useless on its own, because a sectional eats six times the floor space of an accent chair and turns maybe a third as often. A high conversion rate on a slow, space-hungry category can lose you money compared to a lower rate on something dense and quick.
The number worth managing is gross margin per square meter per month. Take a display zone, add up the margin dollars it generated over a period, divide by the meters it occupies and the number of months. Now every fixture, every vignette, every "hero" sectional has a comparable score.
Here's roughly what that looks like across common zones in a mid-size store:
| Zone / category | Footprint (sqm) | Avg monthly margin $ | Margin per sqm/mo |
|---|---|---|---|
| Sofas & sectionals (hero wall) | 42 | $9,800 | ~$233 |
| Dining sets | 30 | $5,400 | ~$180 |
| Bedroom (beds + case goods) | 36 | $6,100 | ~$169 |
| Accent chairs & occasional | 14 | $4,200 | ~$300 |
| Rugs & décor (add-on wall) | 8 | $2,600 | ~$325 |
| Clearance / floor-model corner | 20 | $1,900 | ~$95 |
Once you see it laid out like this, the questions change fast. Why is clearance eating 20 sqm at $95 when accents and décor are the densest earners in the building? Should the hero sofa wall really be the biggest zone if dining and accents out-earn it per meter? That's the conversation a layout should be built around — and it connects directly to the kind of thinking in a category-level assortment scorecard. The assortment decides what deserves floor space; the layout decides where and how much.
How traffic actually moves, and why your best product is in a dead zone
Before you place a single fixture, you need to know where feet actually go. Most showrooms have a predictable movement pattern that owners consistently misjudge.
Eliminate inventory headaches and order delays.
Hosyly streamlines your furniture orders and stock management for seamless store operations.
- Real-time inventory tracking
- Automated order processing
- Customer notifications & engagement
No credit card required
People enter and drift right. They hug the perimeter. They skip the geometric center of a room unless something pulls them in. And there's almost always a decompression zone in the first several meters past the door where shoppers are still adjusting and basically don't register merchandise — putting your best sectional there is like whispering your best pitch in the parking lot.
The pattern that shows up over and over: the highest-margin, fastest-turning items end up wherever was convenient during setup, which is frequently a low-traffic pocket. Meanwhile a slow-moving armoire commands the sightline from the entrance because it "looks impressive." The store is spending its most valuable spatial asset — first-glance attention — on something that barely sells.
A cheap way to map this without any technology: for two weeks, have staff mark a printed floor plan with a tally every time they notice a customer stopping or lingering. You'll get a heat map good enough to expose the dead zones. If you want it cleaner, entrance counters and simple zone-dwell tracking turn that guesswork into numbers you can actually rank fixtures against.
Fixture templates for common footprints
Layout advice falls apart when it stays generic, so here are concrete starting templates by store size. These aren't rules — they're defaults to argue against.
Compact showroom (~250–400 sqm)
-
Single loop path, clockwise, hugging the perimeter
-
Decompression zone kept nearly empty except one low signature piece and signage
-
Densest earners (accents, rugs, décor) placed at the second touchpoint, right after decompression, where attention has switched on
-
One hero vignette visible from the door but placed at the far anchor, pulling traffic through
-
No more than 3–4 fully built room sets; the space can't absorb more without feeling cramped and killing dwell
Mid-size showroom (~600–1,000 sqm)
-
Figure-eight or double-loop path so no zone becomes a dead end
-
Category clustering
bedroom, dining, living each get a defined "room" with its own entrance and exit
-
Cross-merchandising nodes at transitions — a rug and lamp staged between living and dining so add-ons catch people mid-walk
-
A dedicated but small clearance corner, deliberately off the primary path so markdowns don't cannibalize full-price attention
Large showroom (1,200+ sqm)
-
Zoned "neighborhoods" with wide primary arteries and narrower discovery aisles
-
Sightline anchors — a bold piece at the end of each major aisle to keep pulling traffic deeper
-
Deliberate rest points (a styled reading nook, a coffee station) because dwell time correlates with basket size on high-ticket goods
-
Data-instrumented zones so you can compare neighborhood-level margin per sqm and reallocate quarterly
The workflow that ties these together, regardless of size:
-
Map real traffic and dwell before touching fixtures.
-
Score every existing zone on margin per sqm/month.
-
Move your densest earners into your highest-attention zones.
-
Use hero pieces as magnets at the far end, not as gatekeepers at the door.
-
Re-measure after 6–8 weeks and rank again.
Here's a simple visual of that workflow.
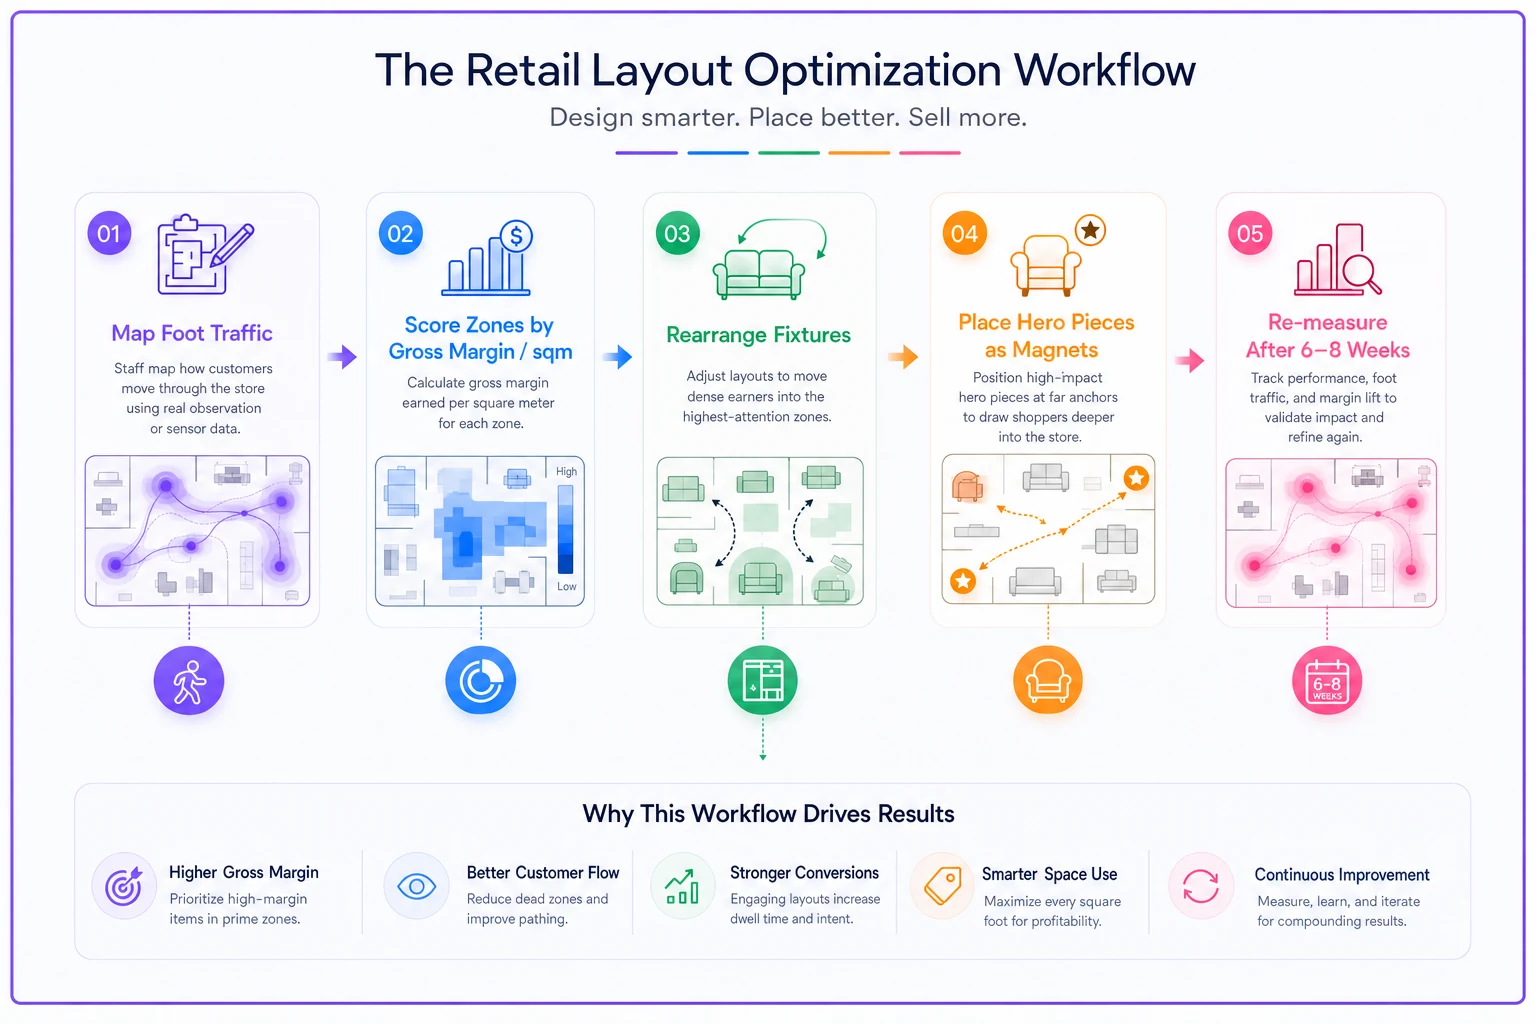
Use this sequence as the recurring cadence for layout decisions.
Sample-rotation cadence: the part that quietly rots
A layout isn't a one-time build because floor samples decay — physically and commercially. A sofa that's been sat on for nine months looks tired, and a design that's past its selling season stops converting even though it's still occupying prime space. Rotation cadence is where good layouts go stale.
The failure mode is running rotation on gut feel. Something gets swapped when it looks beat up, or when a rep pushes a new line — not when the numbers say it's underperforming its footprint. The result is a floor full of pieces that were justified a year ago and haven't been re-earned since.
A workable cadence framework, tied to how a piece performs rather than how it looks:
-
High-traffic hero zones review every 4–6 weeks. If a piece's margin-per-sqm slips below the zone median for two consecutive reviews, it's a rotation candidate.
-
Mid-tier category zones review every 8–10 weeks.
-
Slow/anchor pieces (armoires, formal dining) review quarterly, since they're expected to turn slowly and shouldn't be judged on velocity alone.
-
Wear-based trigger, independent of sales any sample showing visible fatigue — pilling, sun-fade, sag — gets flagged regardless of the calendar, because a tired sample drags the conversion of everything around it.
Deciding whether a fatigued sample gets refreshed, discounted, or pulled is its own discipline; the tradeoffs are covered in showroom rules for protecting margin and display ROI. The layout question is narrower: is this piece still earning its meters? If not, rotation isn't optional.
Merchandising rules that make the math hold
A few operating rules keep a data-driven layout from drifting back into decoration:
-
No dead meters. Every zone gets a margin-per-sqm target. If a zone can't clear a floor threshold for two review cycles, it gets re-purposed, not defended.
-
Adjacency by attachment rate, not by looks. Place products next to what they actually sell with — beds beside nightstands and lighting, sofas beside rugs and side tables. Pull attachment data before staging vignettes.
-
One dominant hero per sightline. Competing statement pieces cancel each other; the eye needs a single anchor per view.
-
Clearance stays off the main path. Markdowns near full-price product reset the customer's price anchor downward and quietly lower what they're willing to pay for everything else.
-
Cap built room-sets by floor size. Room sets sell well but consume enormous space; more isn't better past a point specific to your footprint.
The part most stores miss: these rules only hold if they're checked against real numbers on a schedule. A merchandising rule with no measurement behind it becomes a decorating preference within a month.
Where this breaks as you scale
At one location, a sharp manager can hold most of this in their head. The floor plan lives in their memory, they feel which samples are getting tired, and rotation happens because they walk the floor daily. It works — right up until it doesn't.
Add a second and third location and the whole thing fragments. Each store drifts into its own layout logic. Sample-rotation cadence becomes whatever each manager remembers to do. You lose the ability to compare margin per sqm across stores because nobody's measuring zones the same way. A layout that's crushing it in one location never gets copied to the others because there's no shared record of why it works.
The deeper coordination problem: layout, assortment, and inventory are one connected system, and at scale they stop talking to each other. A piece gets discontinued by purchasing but stays on the floor for weeks because merchandising never got the memo. A hot new line lands in the warehouse but doesn't reach the floor for a month because there's no trigger connecting inbound stock to a rotation slot. Each function optimizes locally and the showroom's per-sqm return leaks out through the gaps between them.
This is where operational software earns its place — not as a magic fix, but as shared memory. When zone footprints, margin-per-sqm scores, rotation dates, and sample condition all live in one system instead of a manager's head and three spreadsheets, you can rank zones across every location, catch when a sample crosses its rotation trigger, and see when a discontinued SKU is still eating floor space. AI-assisted flagging handles the tedious monitoring — watching every zone's numbers against its threshold and surfacing the handful that actually need a decision — so the team spends time deciding, not hunting through data.
A real scenario
A three-location furniture retailer, roughly 700–900 sqm per store, was running each showroom on manager instinct. Layouts were fine to look at, but nobody could say what any zone actually earned.
They spent about six weeks doing the boring groundwork: tallying traffic and dwell, then scoring every zone on margin per sqm per month. The findings weren't flattering. Clearance was occupying prime entrance-adjacent space at one store and dragging price perception across the room. Their densest earners — accents, rugs, lighting — were tucked into low-traffic back corners. And a chunk of floor samples hadn't been rotated in over a year, several visibly worn.
The changes weren't dramatic. Clearance moved off the main path. Accent and décor zones shifted into second-touchpoint positions right past decompression. They set rotation triggers by zone and pulled about a dozen fatigued samples across the three stores. A hero sectional moved from blocking the entrance to anchoring the far wall as a draw.
Over the following quarter, blended margin per sqm rose somewhere in the range of 12–16% across all three locations. Not a revolution — a store that was leaving money in dead zones, and stopped doing that. The bigger win was that they could finally see it, which meant they could keep doing it.
When this is worth the effort — and when it isn't
This kind of spatial discipline pays off when you're carrying high-ticket, space-hungry inventory where a single misplaced zone costs real margin. It's also worth it when you're running multiple locations and need a consistent way to compare them, or when floor space is genuinely constrained and you can't just add square meters to solve a merchandising problem.
It's a bad use of energy if you're a single small store with a naturally simple traffic flow and a manager who already walks the floor daily and knows every piece. At that scale the overhead of formal scoring can outweigh what it surfaces. And nobody should chase per-sqm optimization while the assortment is still a mess — fix what you stock before obsessing over where it sits, or you'll just be beautifully arranging the wrong products.
Your showroom is a system, not a display. Traffic flow, fixture placement, sample rotation, and assortment all feed the same number — what each meter earns. Manage them as connected parts on a schedule, and the floor plan stops being decoration and starts being one of the most reliable profit levers you own.
Your showroom is a system, not a display. Traffic flow, fixture placement, sample rotation, and assortment all feed the same number — what each meter earns. Manage them as connected parts on a schedule, and the floor plan stops being decoration and starts being one of the most reliable profit levers you own.
Ready to elevate your furniture business?
Join 500+ furniture retailers using Hosyly to increase efficiency, improve customer satisfaction, and grow revenue.