



Most furniture stores carry way more SKUs than their showroom can actually display well. The real problem isn't space—it's that category-level performance gets buried across disconnected spreadsheets, vendor reports, and quarterly reviews that happen three weeks too late.
A proper furniture assortment planning system changes how you think about showroom allocation. Instead of treating every category equally, you start measuring space productivity, margin density, and lead-time exposure at the category level. You set entry and exit gates based on seasonality. You run quarterly buy/hold/exit reviews that actually stick.
Stores running structured category scorecards tend to free up a meaningful chunk of showroom space—sometimes around a quarter of it—while lifting margin per square meter noticeably. Not because they're carrying less furniture. They're just carrying the right mix.
Why furniture assortment breaks differently than other retail
Furniture assortment planning faces operational constraints that break traditional retail models. A sofa takes up 4 square meters of showroom space. A dining set needs closer to 12 to display properly. You can't just add another rack when sales pick up.
Lead times compound the problem. When bedroom sets take 16 weeks from order to delivery, you're essentially betting on customer demand four months out. Miss that bet and you're stuck with tens of thousands in inventory eating showroom space during peak season. I've watched a retailer sit on a full bedroom range through an entire spring selling season because they committed too early and couldn't pivot.
Furniture operates on different physics than most retail:
-
Display density matters more than SKU count
-
Customer decisions happen over weeks, not minutes
-
Seasonal patterns vary wildly by category—outdoor furniture and mattresses follow completely different cycles
-
One poor category choice blocks multiple better options
The financial math gets uncomfortable fast. That underperforming sectional occupying 6 square meters? At decent margin-per-sqm rates, it's costing real money in opportunity cost every month it sits there. Multiply that across a dozen weak categories and the number starts to sting.
Building your category scorecard framework
The scorecard starts with three core metrics that actually drive furniture retail performance.
Eliminate inventory headaches and order delays.
Hosyly streamlines your furniture orders and stock management for seamless store operations.
- Real-time inventory tracking
- Automated order processing
- Customer notifications & engagement
No credit card required
Space Productivity (Revenue per sqm) Calculate monthly revenue divided by display square meters for each category. Include the full footprint—the sofa plus the walking space customers need to evaluate it. Most stores discover their best categories generate somewhere between $800 and $1,200 per square meter monthly, while the dogs sit well below that. The gap is usually bigger than people expect.
Margin Density (Gross margin per sqm) Revenue tells half the story. A contemporary bedroom category might generate strong revenue per square meter, but if margins are running 32% versus 48% for traditional styles, you're leaving money on the table. Set minimum thresholds for core categories and hold them accountable.
Lead-Time Risk Score Weight each category by average vendor lead time multiplied by inventory value. When supply chains stretch—and they will—high-exposure categories kill cash flow first. This score keeps those risks visible before they become a crisis.
Include walking space in display sqm calculations to avoid underestimating true space needs.
| Category | Display sqm | Revenue/sqm | Margin/sqm | Lead Risk | Action |
|---|---|---|---|---|---|
| Living Room Sectionals | 45 | $1,100 | $420 | 18 | HOLD |
| Dining Sets | 38 | $650 | $310 | 12 | REDUCE |
| Bedroom Traditional | 42 | $920 | $440 | 14 | EXPAND |
| Bedroom Contemporary | 35 | $580 | $220 | 22 | EXIT |
| Recliners | 28 | $1,250 | $490 | 8 | EXPAND |
| Accent Chairs | 22 | $780 | $380 | 6 | HOLD |
| Outdoor Furniture | 30 | $420 | $180 | 24 | SEASONAL EXIT |
Seeing everything side by side is where it gets useful. That contemporary bedroom category is failing on all three metrics—poor space productivity, weak margins, and high lead-time risk. Meanwhile, recliners crush every metric despite being the least glamorous category on the floor. That kind of contrast rarely shows up clearly until you put it in a table like this.
Seasonal gates that actually protect margins
Furniture seasonality isn't just about patio sets in spring. Every category follows distinct patterns that your assortment planning system needs to respect.
Create entry and exit gates for each category based on historical performance. These aren't suggestions—they're operational rules that trigger real actions.
Spring Gates (March–May)
-
Enter
Outdoor furniture, lighter fabrics, bedroom refreshes
-
Exit
Heavy leather, formal dining, dark wood finishes
-
Space reallocation
roughly a quarter to seasonal categories
Summer Bridge (June–August)
-
Maintain outdoor at peak allocation
-
Begin markdown schedule for spring bedroom
-
Pre-position fall leather arrivals in back stock
Fall Reset (September–November)
-
Exit outdoor to a fraction of peak space
-
Enter holiday dining displays
-
Maximum floor space to sectionals and entertainment
Winter Consolidation (December–February)
-
Compress to core categories only
-
Exit marginal performers completely
-
Bank freed space for spring arrivals
The gates prevent the classic mistake of holding seasonal inventory too long. Outdoor furniture that performs well in May can turn into dead weight by August. You need to force the exit before margins evaporate, not after. One Midwest retailer I know enforced strict seasonal exits for the first time and ended up with several hundred square meters freed up, which they reallocated to categories performing significantly better. The margin lift covered their entire quarterly rent increase.
Quarterly buy/hold/exit cadence
Every quarter, your scorecard triggers three decisions for each category: buy more, hold steady, or exit completely. This isn't a discussion—it's a data-driven process with clear thresholds.
BUY signals (expand category)
-
Margin/sqm exceeds target by 20%+
-
Revenue/sqm in top quartile
-
Lead risk below 15
-
Positive trajectory for two or more quarters
HOLD signals (maintain current)
-
Metrics within 10% of targets
-
Stable performance
-
Strategic importance despite the numbers
EXIT signals (phase out category)
-
Margin/sqm below 70% of target
-
Bottom quartile space productivity
-
Lead risk above 20
-
Declining trajectory for two or more quarters
The quarterly review follows a strict sequence:
-
Week 1
Pull trailing 90-day metrics for all categories
-
Week 2
Apply buy/hold/exit rules, identify conflicts
-
Week 3
Calculate space reallocation scenarios
-
Week 4
Execute showroom moves, update vendor orders
Discipline matters more than perfection here. Stores that run quarterly reviews consistently tend to outperform those doing annual planning by a noticeable margin on space productivity. The cadence is what makes it work.
Showroom reallocation in practice
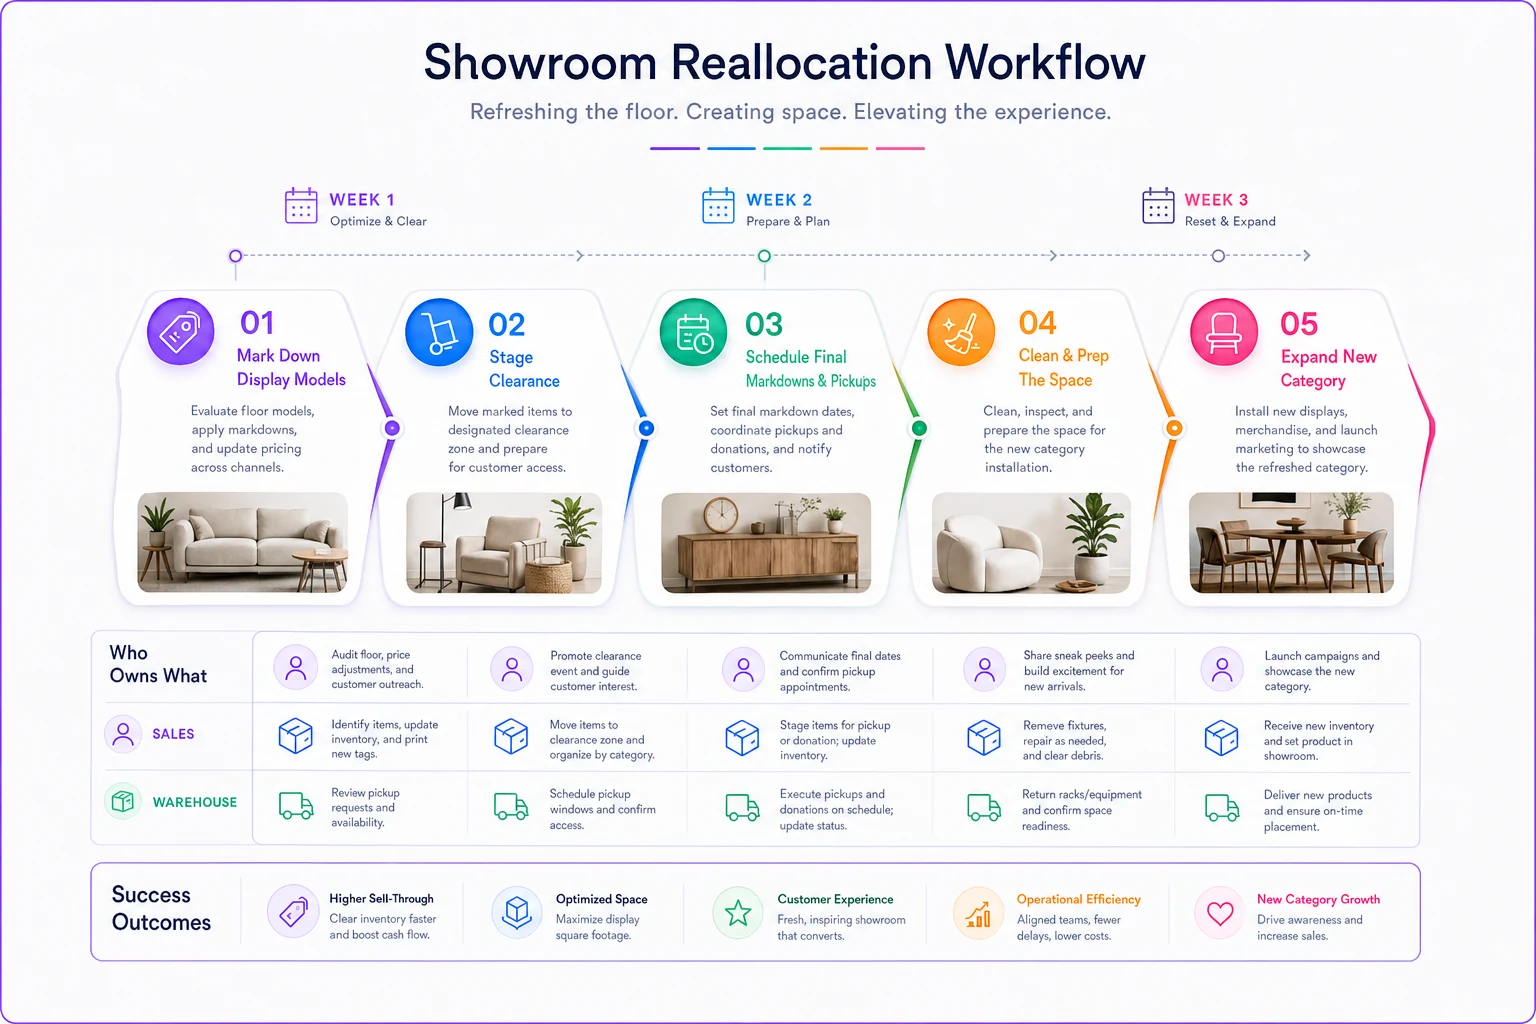
Moving furniture displays isn't like reshuffling apparel racks. Each change requires coordination across sales, warehouse, and delivery teams.
-
Week 1
Mark down display models 30%, move to clearance section
-
Week 2
Final markdowns at 50%, arrange customer pickup
-
Week 3
Clean and prep space for new category
Document the transition workflow:
Contemporary Bedroom EXIT Plan
-
Current space
35 sqm (Zone B, against north wall)
-
Exit timeline
March 1-15
-
Markdown schedule
30% (March 1), 50% (March 8)
-
Staff assignments
John (breakdown), Maria (merchandising)
-
New category
Recliner expansion
-
Required prep
Electrical for power recliners, new lighting
The reallocation follows immediately. That high-performing recliner category currently squeezed into 28 square meters expands into the freed space, absorbing both the bedroom footage and some underperforming dining area.
Track the impact weekly. A properly executed reallocation should show margin improvements within a few weeks as customer traffic naturally flows to better-presented categories. If metrics don't move within 30 days, something in the execution went wrong—worth investigating before the next quarterly cycle.
Here's a simple diagram of the reallocation workflow.
The reallocation follows immediately. That high-performing recliner category currently squeezed into 28 square meters expands into the freed space, absorbing both the bedroom footage and some underperforming dining area.
Templates that scale with your operation
Small furniture stores need different templates than regional chains. Your system should match your operational complexity.
Single-store template (under 10,000 sq ft)
-
8–10 category groups maximum
-
Monthly metric updates
-
Quarterly review cycles
-
Simple spreadsheet tracking
Multi-store template (3–5 locations)
-
15–20 categories with sub-categories
-
Bi-weekly metric updates
-
Monthly mini-reviews, quarterly major reviews
-
Store-level and chain-level views
Regional chain template (5+ locations)
-
Full category tree with 30+ groups
-
Weekly automated updates
-
Monthly category reviews
-
District-level optimization
Template complexity should never exceed your team's ability to maintain it. A simple system used consistently beats a complex system that gets abandoned after two quarters—and that happens more often than you'd think.
Common scorecard mistakes that kill implementation
Mistake 1: Perfect metrics that nobody updates Teams spend weeks building elaborate scorecards with 15 metrics per category, then abandon updates after month two. Better to track three metrics religiously than 15 sporadically.
Mistake 2: Ignoring sales team feedback Your scorecard says eliminate contemporary bedroom, but your sales team knows three designers specifically request that line. The numbers matter, but so do customer relationships. Build "strategic hold" exceptions into your system.
Mistake 3: Moving too fast Reallocating half your showroom in one quarter sounds aggressive until customers can't find anything and sales tank. Limit changes to around 20% of showroom space per quarter—more than that and the disruption starts working against you.
Mistake 4: Forgetting vendor relationships That underperforming dining category might be your ticket to exclusive rights on a hot new living room line from the same vendor. Consider vendor portfolio impacts before making exits.
Mistake 5: Seasonal gate rigidity Your template says exit outdoor furniture by September 1, but you're having the warmest fall in years. Build override protocols for exceptional circumstances.
The common thread across all five mistakes is the same: the scorecard becomes the entire strategy instead of a tool that supports judgment. Use it as a forcing function, not a rulebook.
When operational software handles the heavy lifting
The biggest barrier to consistent scorecard implementation isn't building the system—it's maintaining it when everything else is competing for your attention.
This is where AI-powered operational software actually earns its keep. Instead of manually updating spreadsheets, modern platforms pull your sales, inventory, and space data automatically. They calculate key metrics daily, flag categories falling below thresholds, and suggest reallocation scenarios based on performance trends. Some systems use predictive models to forecast slow-moving inventory patterns before they become showroom anchors.
The automation goes beyond tracking. These platforms can monitor seasonal patterns and trigger gate notifications automatically, analyze quarterly results, and generate buy/hold/exit recommendations based on your specific thresholds. When it's time to retire slow-moving SKUs, the system already has a phased exit plan mapped out.
The real value is consistency. Stores using automated scorecard platforms run their quarterly reviews reliably because the data is already there, analyzed and ready. No scrambling to pull reports, no arguing about what the numbers mean.
Making the scorecard stick long-term
Success with furniture assortment planning comes down to discipline, consistency, and gradual improvement. Not a glamorous formula, but it's the one that actually works.
Pick five core categories and build scorecards for those first. Run two quarterly cycles before expanding. Get your team comfortable with the buy/hold/exit rhythm before adding complexity. Rushing the rollout is how you end up with an abandoned spreadsheet by Q3.
Document everything. When you exit a category successfully, write down what worked. When a reallocation fails, capture why. These notes become your operational playbook and make future decisions faster and less stressful.
Set realistic targets. Improving margin per square meter by 10% in year one is solid progress. Expecting 50% immediately leads to reckless decisions that damage customer relationships and vendor trust.
The stores that win with category scorecards aren't the ones with the fanciest metrics or the most aggressive targets. They're the ones reviewing their scorecards every quarter without fail, making incremental improvements, and trusting the process even when individual decisions feel uncomfortable. Your showroom has finite space—every square meter allocated to a weak category is one that a stronger one can't have. The question isn't whether to implement a category scorecard. It's how much margin you're willing to leave on the table while waiting to start.
Ready to elevate your furniture business?
Join 500+ furniture retailers using Hosyly to increase efficiency, improve customer satisfaction, and grow revenue.