


Most furniture retailers don't have a data problem. They have a sequencing problem. They try to build forecasting models before their catalog is clean, or they automate reorder triggers while their return reasons are still logged as free-text across three different systems. The analytics fail, everyone blames "the numbers," and the business quietly goes back to gut-feel decisions that worked fine at $2M in revenue but start leaking cash at $8M.
What separates retailers who actually get value from data versus the ones who keep buying dashboards nobody opens is the order of operations. You can't skip stages. A validated demand model sitting on top of a catalog where the same dining table exists under four SKU variations with inconsistent dimensions isn't a model — it's a confident liar.
This is a maturity roadmap, not a tool list. It's built around the specific signals furniture operations actually run on: SKU attributes, quote-to-order behavior, and return and claim reasons. And it ends where most retailers should stop for a while — safe, gated automation that handles the boring decisions without silently making expensive mistakes.
Why furniture data maturity looks different
Furniture isn't apparel and it isn't electronics. The data challenges are specific:
-
Long lead times mean your signals are old by the time they matter. A quote today might convert in six weeks and deliver in fourteen.
-
Bulky, configurable SKUs generate messy catalogs — same frame, different fabrics, different dimensions, different freight classes.
-
High ticket, low frequency means you never have enough transactions per SKU to trust naive statistics. A sofa that sells eleven times a year isn't a forecasting problem you solve with a moving average.
-
Returns and damage claims carry real operational cost and real signal — but only if the reasons are captured consistently.
Retailers who copy an analytics playbook from a faster-moving retail vertical usually crash at stage one. The data is too sparse and too dirty to support the models they're excited about.
The maturity model below has four stages.
| Stage | What it produces | Entry requirement | Main failure if skipped |
|---|---|---|---|
| 1. Catalog hygiene | A trusted SKU spine | Agreed attribute schema | Every downstream number is wrong |
| 2. Signal catalog | Clean quote/order/return events | Stage 1 passing weekly | Models trained on noise |
| 3. Validated models | Forecasts and decision rules you can audit | 6–12 months of clean signal | Confident bad recommendations |
| 4. Safe automation | Gated actions on low-risk decisions | Backtested models + guardrails | Silent expensive mistakes at scale |
Each one has an entry gate — a quality bar you must clear before the next stage produces anything trustworthy.
Stage 1: Catalog hygiene — the unglamorous foundation
Nobody gets excited about catalog cleanup. It's the data equivalent of fixing the plumbing before repainting. But every retailer who skips it ends up back here eventually, usually after a forecasting project embarrasses itself.
Eliminate inventory headaches and order delays.
Hosyly streamlines your furniture orders and stock management for seamless store operations.
- Real-time inventory tracking
- Automated order processing
- Customer notifications & engagement
No credit card required
Furniture catalogs grow organically. A vendor sends a spreadsheet, someone keys it in, a configurator spins up variants, and six months later nobody knows which of the three "Harper Sectional" entries is the real one. Dimensions disagree. Freight class is blank on 40% of SKUs. The same fabric is spelled "charcoal," "Charcoal," and "CHRCL."
-
Every sellable SKU has consistent, validated physical attributes (dimensions, weight, freight class, carton count)
-
Variant relationships are explicit — you know the Harper Sectional has one parent and nine fabric children, not nine orphan SKUs
-
Vendor SKU maps to your internal SKU cleanly
-
Discontinued and active status is reliable, not inferred
The entry gate for Stage 2 is simple and brutal: your catalog should pass an automated validation check every week with a clear, falling error count. If you can't produce a weekly "SKUs failing validation" number, you're not out of Stage 1.
This kind of structured specification work is what makes everything downstream possible — the discipline behind a machine-readable SKU and carton schema with validation and ATP math is what turns a messy catalog into something analytics can actually stand on.
-
A catalog owner (often an ops lead, not a full-time hire at this stage) who owns the schema and signs off on new SKU onboarding
-
A 48-hour SLA on validating any new vendor SKU before it goes sellable
-
A weekly reconciliation where failing SKUs get assigned owners
A typical example: a retailer doing around $6M discovers that roughly 18% of their active SKUs have missing or wrong freight class. That single gap was quietly inflating delivery cost estimates and causing checkout quotes to be wrong often enough that the sales team had stopped trusting system numbers entirely. Fixing it didn't require AI. It required one person, a validation rule, and about eight weeks of grind.
Run the weekly SKU validation as part of the onboarding checklist for any new vendor to catch errors early.
When Stage 1 is "good enough" to move on
You don't need perfection. You need the error rate low and falling, and you need the attributes that actually drive decisions — dimensions, freight class, variant mapping, active status — to be trustworthy. Cosmetic data like marketing descriptions and secondary photos can lag. Don't let a perfectionist hold the whole program hostage over fields that don't feed any decision.
Stage 2: The signal catalog — capturing what actually happened
Once the SKU spine is clean, the next job is capturing events cleanly. This is where most retailers have a hidden mess they don't know about, because event data is scattered across the POS, the quoting tool, the delivery system, and someone's spreadsheet of returns.
A signal catalog just means a reliable, consistent record of the three signal families that drive furniture decisions:
-
1. SKU signals — availability, lead time, cost, freight class changes over time. Not just the current value, but the history.
-
2. Quote signals — this is the one almost everyone under-captures. Quotes that don't convert are enormously valuable. If you only record orders, you're blind to demand you lost on price, lead time, or availability.
-
3. Return and claim signals — and critically, the reason, captured as a structured code, not free text. "Damaged in transit," "customer changed mind," "wrong dimensions," "color mismatch" are completely different operational problems. If they all land in one text field, you've thrown away the signal.
This pattern comes up repeatedly: a retailer has three years of order history but can't answer "how often did we lose a quote because lead time was over eight weeks?" — because quote outcomes were never structured. They have the data. They just never captured the signal.
Here's a text-based view of what a clean signal catalog actually needs:
> Quote created → captured with SKUs, price, promised lead time, timestamp > → Quote outcome logged (won / lost / expired) with reason code > → Order flows to fulfillment → delivery outcome logged > → Return/claim, if any, logged with structured reason + linked back to original SKU and freight class
Each arrow is a handoff, and each handoff is where retailers lose data. The quote tool doesn't talk to the return system, so you can never ask "do the SKUs we return most often also have the highest lost-quote rate on lead time?" — which is one of the most useful questions in the whole business.
Quality gates for Stage 2:
-
Quote outcomes captured for at least 90% of quotes
-
Return reasons structured (coded), with free-text as a secondary field only
-
Signals linked back to the clean SKU spine from Stage 1
-
Delivery outcomes tied to orders
This is the stage where a proper demand-to-supply data platform earns its keep — not because it's clever, but because it stops signal leaking out through the gaps between systems.
Staffing reality: Stage 2 usually needs someone part-time who understands both operations and data — not a data scientist. The work is plumbing and definitions, not modeling. A retailer in the $5M–$10M range can often run this with existing ops staff plus a clear owner, maybe 10–15 hours a week once the initial setup is done.
Stage 3: Validated models — earning the right to be trusted
Now you have clean SKUs and clean signals. Now you can build models — forecasts, reorder rules, lead-time hedges — and actually trust them.
The word that matters is validated. A model you can't backtest is just an opinion with math on it. For slow-moving, high-ticket furniture, this is non-negotiable, because you don't have enough volume to catch a bad model quickly. By the time a flawed reorder rule for an $1,800 sofa reveals itself, you've either stocked out through a whole season or you've got eleven units sitting in a warehouse eating working capital.
What validation looks like in practice:
-
You hold out recent history, run the model as if you didn't know the outcome, and compare predicted vs. actual
-
You measure error honestly — not "the model was close on the bestsellers" but "where did it fail, and how expensive were those failures?"
-
You know the model's blind spots — for sparse SKUs, cohort and rule-based approaches usually beat clever statistical models, because there simply isn't enough data per SKU to fit anything fancy
The models that look most impressive in a demo are usually the most dangerous in furniture, because they overfit on thin data. The boring cohort-and-rule approach that groups similar SKUs and applies sensible thresholds tends to be far more robust.
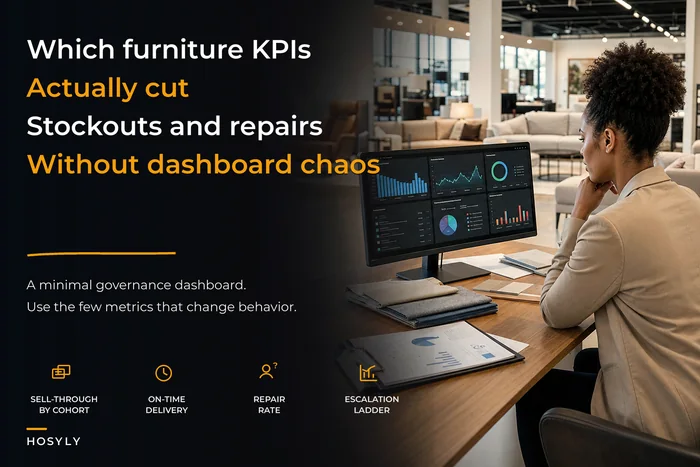
This is also the stage where your KPIs have to be honest. If your dashboard celebrates vanity metrics, your validated models will optimize toward the wrong thing. Building a minimal governance dashboard focused on the KPIs that actually reduce stockouts and repairs keeps the model's objectives aligned with what actually matters, rather than what looks good in a board deck.
Quality gates for Stage 3:
-
Every production model has a documented backtest with error bounds
-
Models are segmented by signal density (don't run the same approach on a 300-unit-a-year accessory and an 11-unit-a-year sectional)
-
Someone can explain, in plain language, why a model made a given recommendation
-
There's a defined re-validation cadence — quarterly at minimum, or after any major demand shift
Staffing: This is where a dedicated analyst, or a well-chosen platform, starts to pay for itself. For a retailer in the $10M–$25M range, one analytically capable person who owns model validation is usually the right investment. Below that, lean on rule-based systems and your ops lead rather than hiring ahead of the data.
Who should NOT be at Stage 3 yet
If your catalog validation still throws hundreds of errors a week, or your quote outcomes aren't captured, you are not ready to build models. Full stop. Retailers skip ahead because modeling is interesting and plumbing is boring. The result is confident, well-presented, wrong recommendations. That's worse than no model, because people act on it.
Stage 4: Safe automation — gated, boring, and auditable
The final stage isn't "let the system run everything." It's letting automation handle the low-risk, high-frequency decisions while keeping humans on anything expensive or ambiguous. In furniture, that distinction is everything, because the cost of a wrong automated decision scales with the ticket size.
Think of it as a spectrum:
-
Auto-approve safe reordering a fast-moving accessory within its validated range, flagging a SKU whose lead time just jumped, auto-routing a damage claim to the right queue by reason code
-
Recommend, human approves reordering a high-ticket slow mover, adjusting safety stock after a demand shift
-
Human only anything above a cost threshold, anything the model flags as low-confidence, anything involving a new vendor or SKU without history
The guardrails are what make this work without blowing up:
-
Confidence threshold. The model only acts automatically when its backtested confidence clears a bar. Below it, a human decides.
-
Value ceiling. Any action above a dollar threshold routes to a person, regardless of confidence.
-
Rate limiting. No automated process can reorder more than X units or trigger more than Y actions in a window without review — this stops a bad signal from cascading.
-
Anomaly brakes. If current data deviates sharply from what the model trained on, automation pauses itself and escalates.
-
Full audit trail. Every automated action is logged with the signal and model version that triggered it, so you can trace and reverse mistakes.
A realistic rollout sequence:
-
Start with read-only automation — the system recommends, humans act, for about a quarter. Measure how often you'd have agreed.
-
Turn on auto-action for the safest, lowest-value decision class only.
-
Watch override rates. If humans override automated decisions more than roughly 10–15% of the time, the gate is set wrong — pull back.
-
Expand scope one decision class at a time, never all at once.
-
Review the audit log monthly for any action that cost real money and shouldn't have.
When safe automation is actually a bad idea
Below roughly $5M in revenue with a manageable SKU count, aggressive automation is usually premature. The volume of decisions doesn't justify the setup cost, and your ops team can still hold the whole picture in their heads. Automation earns its place when the number of routine decisions exceeds what people can handle well — not before. Automating decisions you don't yet understand just means making mistakes faster.
Here's a simple workflow view of safe automation gates and human handoffs.
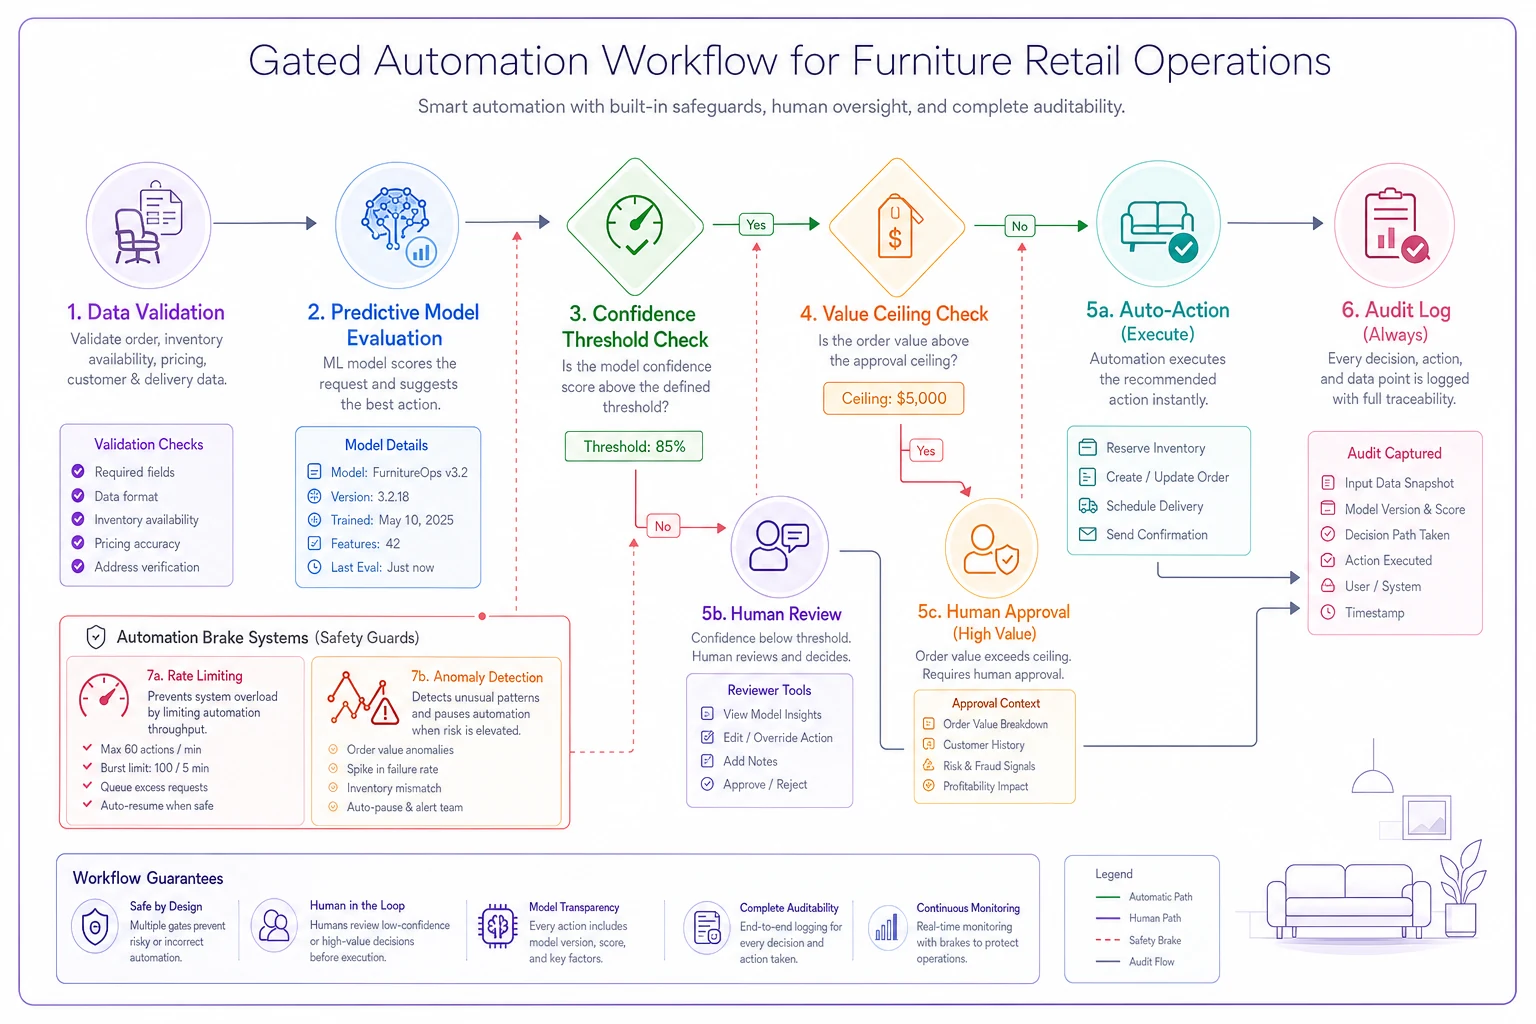
A realistic rollout follows the sequence above, with careful monitoring of overrides and audit logs to catch problems before they scale.
A real scenario: a mid-size retailer climbing the stages
A furniture retailer running three showrooms and an online channel, somewhere around $9M in revenue, came in convinced they needed "AI forecasting." Their actual situation:
-
Roughly 2,200 active SKUs, of which about 15% had missing freight class or inconsistent dimensions
-
Quote outcomes captured for maybe half of all quotes — mostly the wins
-
Return reasons logged as free text, unusable for analysis
-
A forecasting tool they'd bought and abandoned because "it was always wrong"
Of course it was wrong. It was built on stage-one chaos.
They spent the first quarter on catalog hygiene. Not glamorous, but by the end the weekly validation error count had dropped from several hundred to under thirty. The next quarter went to the signal catalog: structured return reasons and quote-outcome capture across all channels. Only after that did they revisit forecasting — this time with cohort-based rules for the slow movers instead of a one-size model.
The payoff wasn't a dramatic revenue number. It was quieter than that. Lead-time-driven lost quotes became visible for the first time, which led them to renegotiate with two slow vendors. Return reason data showed that a specific sectional accounted for a disproportionate share of transit-damage claims — a packaging issue they'd been eating blindly for over a year. Stockout frequency on reliable mid-ticket SKUs dropped noticeably once reorder rules were trained on clean, validated signal.
No part of that required stage four. They got most of the value from stages one through three. Automation came later, and only for the safe, boring decisions.
The order is the whole point
Furniture data maturity is a sequence you don't get to shortcut. Clean the catalog. Capture the signals — especially the quotes you lose and the reasons things come back. Build models you can actually audit, sized to how sparse your data really is. Then, and only then, automate the decisions that are low-risk enough to hand off safely, with gates that catch mistakes before they get expensive.
The retailers who struggle aren't the ones with less data. They're the ones who built stage four on a stage-one foundation and then wondered why the numbers couldn't be trusted. Get the order right, hold each quality gate honestly, and the analytics stop being a dashboard nobody opens — they become the quiet system that catches problems while you're focused on selling furniture.
Ready to elevate your furniture business?
Join 500+ furniture retailers using Hosyly to increase efficiency, improve customer satisfaction, and grow revenue.