



Most furniture stores track way too much. We're talking 40+ metrics spread across spreadsheets, POS reports, delivery logs, and random notebooks behind the register. Meanwhile, they're still running out of best-sellers during peak season and dealing with damaged deliveries every other week.
The problem isn't lack of data. It's drowning in it while missing the four numbers that actually predict whether you'll have stock when customers want it — and whether that stock arrives intact. Stores that focus on a tight set of furniture-specific KPIs catch problems weeks before they hit the showroom floor. Stores tracking everything catch problems after customers complain.
Why furniture KPIs break differently than regular retail
Furniture operates on completely different physics than apparel or electronics. Your average sofa takes 12–16 weeks from order to delivery. A damaged dining table can't just be swapped from backstock — you might wait another three months for a replacement. And unlike a broken phone case that gets tossed, a wobbly chair becomes a warranty claim, a repair dispatch, and potentially a negative review sitting online forever.
This creates cascading measurement problems. Traditional retail KPIs assume quick turnover and easy replacement. They assume damage means write-off, not repair. They assume stockouts last days, not months.
Take sell-through rate. In fashion retail, you measure this weekly or monthly. In furniture, you need cohort-based tracking because that sectional ordered in January might not land until April, sell in June, and get delivered in July. A simple monthly sell-through completely misses this.
Or conversion metrics. Regular retail measures conversion per visitor. But when someone spends 45 minutes sitting on different sofas, brings their family back twice, then orders something custom that won't arrive for four months — traditional conversion tracking becomes meaningless noise.
The stores that win understand these differences and build their furniture store KPI dashboard around the unique realities of selling, storing, and delivering large, expensive items with long lead times.
Sell-through by arrival cohort
Sell-through by arrival cohort
Eliminate inventory headaches and order delays.
Hosyly streamlines your furniture orders and stock management for seamless store operations.
- Real-time inventory tracking
- Automated order processing
- Customer notifications & engagement
No credit card required
Forget monthly sell-through rates. Track by arrival cohort instead.
Everything that arrives in March gets tagged as the "March cohort." You then track what percentage sells at 30, 60, 90, and 120 days. This tells you immediately if something's dead on arrival versus just slow to start.
-
30 days
15–20% sold
-
60 days
35–40% sold
-
90 days
55–65% sold
-
120 days
70–80% sold
Anything below these benchmarks signals a pricing problem, a placement issue, or a dead SKU that needs aggressive action. Moving a slow-selling ottoman just 10 feet closer to its matching sofa set can shift 60-day sell-through from 20% to 55% — it's happened more than once.
This cohort view also reveals seasonal patterns that are easy to miss otherwise. Outdoor furniture arriving in July might look like a disaster with 10% sell-through at 30 days, but historical cohorts show July arrivals almost always pick up the following March when people start planning for summer.
Conversion per square meter by zone
Conversion per square meter by zone
Total showroom conversion tells you nothing useful on its own. A 3% overall conversion rate could be hiding a hero zone converting at 8% and a dead zone stuck at 0.5%.
Map your showroom into six to eight zones. Track not just traffic but actual engagement time and conversion by zone. Most POS systems can't do this natively, so you'll need manual tracking or camera-based analytics.
-
Front third of store
2–3% conversion
-
Dedicated room settings
5–7% conversion
-
Clearance corner
1–2% conversion (but higher transaction values)
-
Custom order desk
12–15% conversion
One store had their "premium" zone near the back converting at 0.8% despite displaying their highest-margin pieces. Customers assumed that area was staff-only because of how it was lit. A simple lighting change and some welcoming signage pushed conversion to 4.2% within a month.
On-time delivery rate (not just delivery completion)
On-time delivery rate (not just delivery completion)
Most furniture stores track whether deliveries happened. Almost none track whether they happened when promised.
The real metric is the percentage of deliveries completed within the originally promised window. Not rescheduled. Not "attempted." Actually delivered when you told the customer it would arrive.
Industry average hovers around 65–70%. The best operators hit 85–90%. The difference is that they track this religiously and trace every failure back to its root cause:
-
Supplier shipped late
~23% of failures
-
Damage in transit requiring reorder
~18%
-
Customer not home
~15%
-
Delivery crew capacity issues
~12%
-
Wrong item pulled from warehouse
~8%
That breakdown tells you exactly where to focus. If supplier delays dominate, you need better vendor SLAs or more buffer time built into your promises. If damage keeps driving failures, review your packaging requirements and carrier handling.
First-time repair resolution rate
First-time repair resolution rate
Repairs happen. What matters is whether they get fixed right the first time.
The metric: repairs completed on first visit divided by total repair attempts.
Anything below 80% means you're hemorrhaging money on multiple truck rolls, angry customers, and tied-up inventory. The best operators hit 90–95% first-time resolution.
The key is categorizing repair types and tracking resolution by category:
-
Structural issues (legs, frames)
95% first-time resolution expected
-
Upholstery tears
85% first-time resolution expected
-
Mechanism failures (recliners, adjustable bases)
75% first-time resolution expected
-
Cosmetic scratches
98% first-time resolution expected
When a category drops below its threshold, you know exactly what to address — better tech training, different parts inventory, or clearer damage assessment protocols before the truck rolls.
Building your governance rhythm
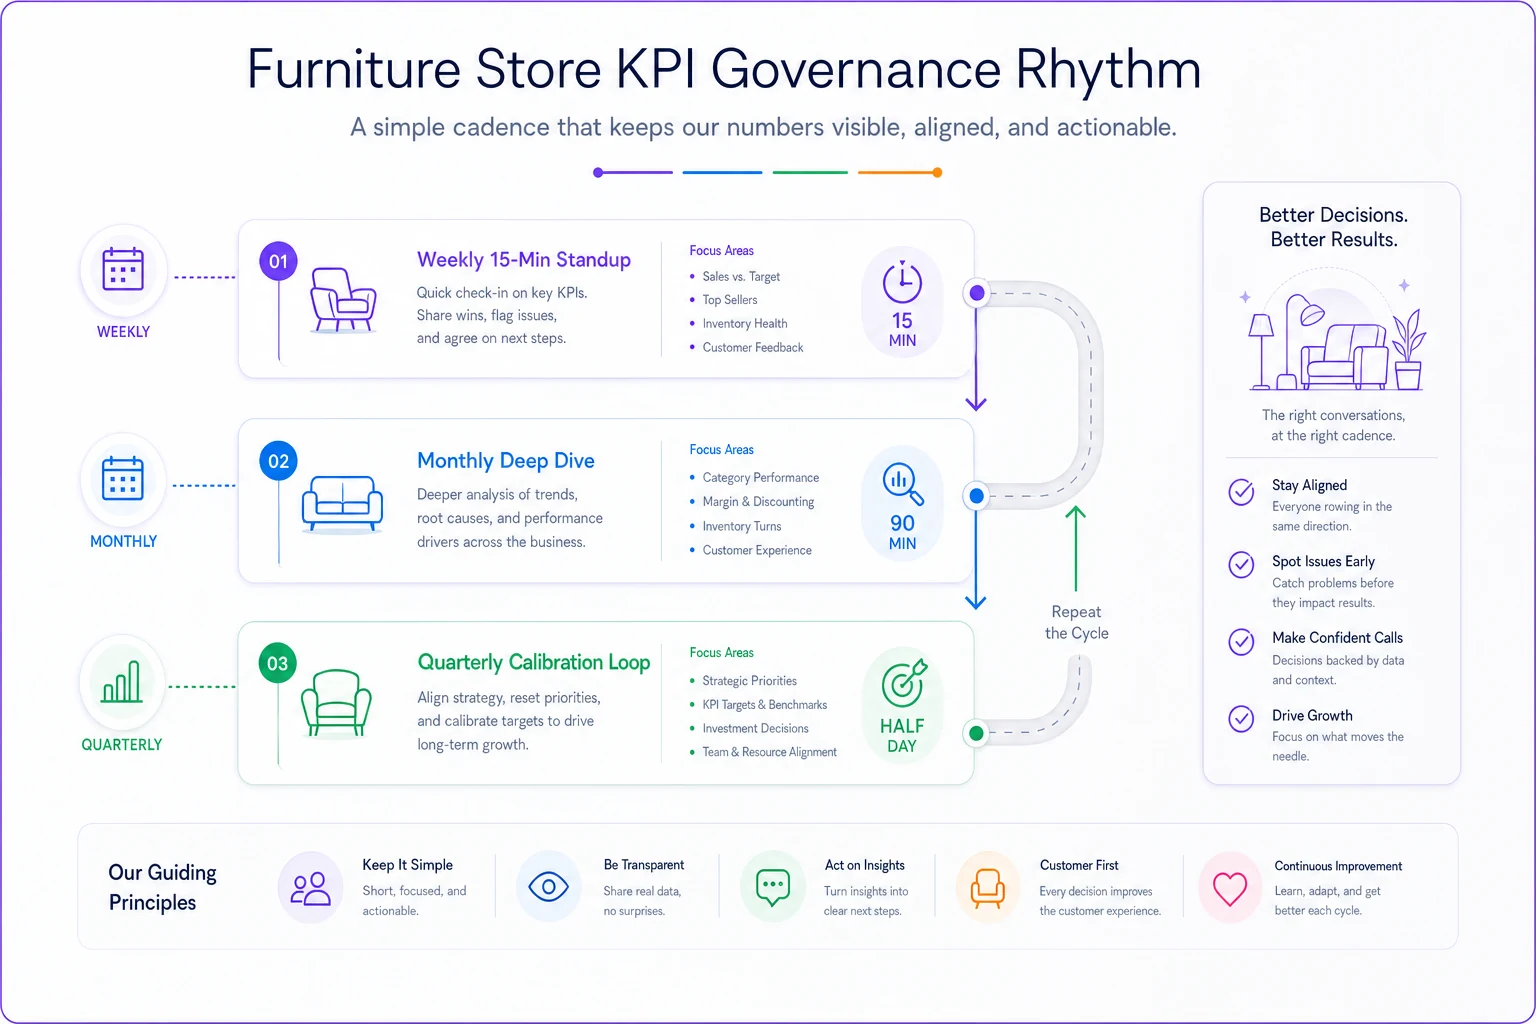
The weekly 15-minute standup
Every Monday morning, pull these four numbers for the previous week. No presentation. No slides. Just numbers on a whiteboard:
-
Cohort sell-through for items at 30 and 60 days
-
Conversion by zone for weekend traffic
-
On-time delivery percentage
-
Repair tickets opened versus closed
Any number outside normal range gets a single question: "What's the plan?" This isn't a strategy session. It's a health check. If your 30-day sell-through drops below 15%, someone needs to own fixing it by next Monday. If Zone 3 conversion tanked, someone walks the floor that day to figure out why.
Keep the standup strictly timed — two minutes per store keeps multi-location calls crisp.
Multi-location operators can run this as a 15-minute video call across all stores. Each location reports their four numbers — two minutes per store. Problems surface immediately instead of hiding in monthly reports.
Here's a simple visual of the governance rhythm.
The monthly deep dive
First Tuesday of every month, spend around 90 minutes going deeper.
Review full cohort curves for everything that arrived four or more months ago. Anything still sitting at sub-50% sell-through needs a retirement plan.
Analyze delivery failures by root cause and look for patterns. Three late deliveries from the same supplier? Time for a conversation. Multiple damage claims on the same SKU? Check the packaging specs.
Compare zone performance month-over-month. Did that layout change actually help? Is the new lighting working?
Review repair categories. Rising mechanism failures might point to a quality issue with a specific product line or supplier.
This session produces actions, not just observations. Each problem gets an owner and a deadline.
The quarterly calibration
Every quarter, benchmark against yourself and against market expectations:
-
Are your sell-through curves improving or degrading?
-
How does your on-time delivery rate compare to what customers actually expect?
-
Is your repair rate trending up or down?
-
Which zones consistently underperform?
This is when you make bigger changes. Maybe that back corner needs a complete reconfiguration. Maybe you need to rework supplier transit agreements to improve on-time rates. Or rising repair resolution issues suggest switching service providers altogether.
The weekly escalation ladder
The escalation ladder that actually gets things fixed
Level 1: Floor manager owns it (daily issues)
-
Single SKU underperforming in its cohort
-
One-off delivery delay
-
Single repair taking longer than expected
-
Zone conversion off by less than 20%
Floor managers have authority to reprice, reposition, or expedite within limits. No committee needed.
Level 2: Operations manager steps in (weekly patterns)
-
Multiple SKUs from the same vendor underperforming
-
Delivery delays forming a pattern — three or more in a week
-
A repair category showing consistent problems
-
Zone conversion off by 20–40%
Ops manager can modify vendor orders, change delivery routing, bring in additional repair resources, or approve floor plan changes.
Level 3: Owner/GM engagement (systemic issues)
-
An entire category failing cohort benchmarks
-
On-time delivery below 60% for two consecutive weeks
-
First-time repair resolution below 70%
-
Multiple zones underperforming simultaneously
This triggers a strategic review — vendor relationships, pricing, operational capacity, or showroom design. Something structural is broken.
Your dashboard template (keep it simple)
Main Dashboard Tab:
-
Week number
-
Cohort sell-through (30/60/90/120 day columns)
-
Zone conversion (one column per zone)
-
On-time delivery %
-
Repair resolution %
-
Sparkline charts showing 8-week trends
Cohort Detail Tab:
-
SKU listing by arrival month
-
Units received
-
Units sold at each interval
-
Current stock
-
Weeks on floor
Delivery Performance Tab:
| Order number | Promise date | Actual date | Delay reason (if applicable) | Root cause category |
|---|---|---|---|---|
| Order number | Promise date | Actual date | Delay reason (if applicable) | Root cause category |
Repair Tracking Tab:
-
Ticket number
-
SKU
-
Issue category
-
First visit date
-
Resolution date
-
Number of visits required
Once you have the rhythm down, this takes about 30 minutes a week to update. The insights it generates save dozens of hours of firefighting.
Data patterns that signal specific problems
Pattern 1: The "dead on arrival" SKU
-
30-day sell-through
0%
-
60-day sell-through
5%
-
90-day sell-through
8%
This isn't just slow-moving. Something is fundamentally wrong — pricing is completely off, the product didn't match expectations, or it's placed where nobody sees it.
Pattern 2: The "quality disaster" vendor
-
On-time delivery
82% (looks fine)
-
But repair rate on their items
18% (versus 5% average)
-
First-time repair resolution
60% (versus 85% average)
Delivery metrics look acceptable, but this vendor is eating your margin and destroying customer satisfaction quietly in the background.
Pattern 3: The "conversion dead zone"
-
Zone traffic
Normal
-
Dwell time
Actually higher than average
-
Conversion
0.5% (versus 3% showroom average)
Customers are interested enough to linger but something stops them from buying. Usually pricing confusion, missing inventory cards, or product information that raises more questions than it answers.
Pattern 4: The "false winner"
-
30-day sell-through
45% — looks great
-
But returns and repairs at 60 days
25%
Sells fast but comes back damaged or unsatisfactory. You're essentially renting furniture, not selling it.
When automation makes this sustainable
Manual tracking works for maybe six weeks. Then someone goes on vacation, deliveries stack up, and the dashboard goes stale. This is a completely predictable failure mode.
Connecting your POS, delivery system, and repair tracking into a unified furniture store KPI dashboard changes this. Instead of manual data entry, metrics update automatically. Instead of weekly Excel updates, you get daily snapshots. Instead of catching problems next week, you see them today.
The operational software platforms that work best for furniture aren't generic retail solutions with some light customization. They're built around the specific realities of long lead times, cohort tracking, zone-based conversion, and repair workflows. They understand that a sofa isn't a sweater and a delivery isn't just shipping.
When these systems include AI automation, they go beyond tracking to predicting — flagging when a new SKU's early sales pattern matches previous failures, alerting when a vendor's on-time rate starts degrading before it becomes critical, identifying which repair types are increasing and surfacing patterns that suggest preventive action.
But even with automation, the discipline matters more than the technology. The stores that succeed commit to the rhythm — weekly standups, monthly deep dives, quarterly calibrations. They use escalation ladders so problems get solved rather than discussed endlessly. And they keep their KPI set minimal.
Making this work in your store
Start tomorrow. Don't wait for perfect data or better software.
Pick your zones, even roughly. Start tracking this week's arrivals as a cohort. Log next week's delivery promises and track what percentage actually hit their dates. Create a simple repair log.
Within four weeks, patterns emerge. That corner everyone assumed was prime real estate? Converting at 1%. That vendor everyone loves working with? Late 40% of the time. That new line you were excited about? Trending toward dead inventory.
More importantly, you stop managing by gut feel and start managing by what's actually happening. You catch stockouts before they happen by watching sell-through accelerate. You prevent repair problems by spotting quality issues early. You optimize your showroom by understanding which zones are actually driving purchases.
Stores running on intuition and monthly P&L reviews are always fighting last month's battles. The ones running tight KPI governance are preventing next month's problems. In a business where a single stockout can mean three months of lost sales and a quality issue can quietly shred your reputation, that gap matters more than most owners realize. Keep the metrics minimal. Make the rhythm non-negotiable. Let the data drive decisions. Within about 60 days, the improvements tend to become obvious — fewer stockouts, fewer repeat repair visits, and noticeably less operational chaos.
Ready to elevate your furniture business?
Join 500+ furniture retailers using Hosyly to increase efficiency, improve customer satisfaction, and grow revenue.